
VRA Update: 25,000 Year End Dow Jones. The VRA Approach to Crushing the Market, Sentiment Back to Heavily Bullish Readings.
 Kip Herriage -VRAInsider.com
 Nov 17, 2017
Good Friday Morning all. A big recovery day in the markets yesterday, with 1% to 1.5% moves higher across the board in the Dow Jones, S&P 500, Nasdaq and Russell 2000.
As we’ve covered here often, in powerful equity bull markets like the one we are in today (globally) corrections are short-lived, quickly reversed and soon thereafter lead to fresh all-time highs. This is what we witnessed the beginning of yesterday. Take a look at these internals:
1) 4–1 across the board, advances to declines
2) Almost 10–1 new highs to new lows
3) Nasdaq at close to 10–1, up volume to down volume
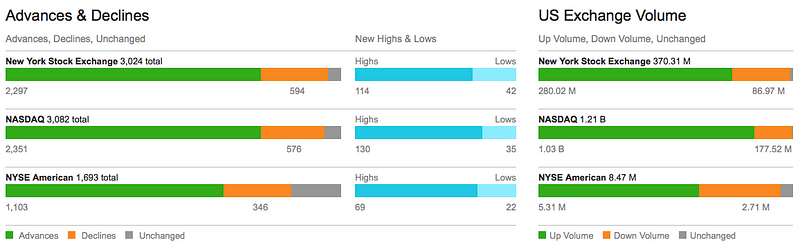
The internals of the stock market make up an important element of the VRA Investing System. Even during the “pause” the markets internals held up well. Were this to be a large decline in the offing, the internals would have been negative, over a 7–14 day cycle. We did not get a whiff of this…instead, we saw a near immediate reversal move on heavy volumes.
Combined with the manner in which investor sentiment flipped from bullish to bearish over the course of just one week…along with record numbers of investors buying the VIX (fear index)…the VRA System signal was clear; the pause was to be short-lived only. Next up, the year end rally is ON. My DJ target of 25,000 by end of 2017 remains intact.
The VRA Approach to Crushing the Market
Going back to inception of the VRA in 2003, each year we have outperformed the markets (using the S&P 500 and Russell 2000 as benchmarks) in 13 of 14 years. Through the 3rd quarter of 2017, our positions were up an average of 44%, versus just 11% for the S&P 500 and 9% for the Russell 2000.
Going back these 14 years we have had numerous VRA buy rec growth stocks that have risen 500–1000% while also using the VRA System to time our purchases of leveraged ETF’s and big cap domestic/international buy recs, giving us exposure to the broad markets as well.
The VRA has always been aggressive. It always will be. My investing style is not for everyone, for just this reason, but for those willing to invest a portion of your funds in high growth opportunities, well…this is my niche market. This is my USP (unique selling proposition).
I have always recommended building concentrated positions in my favorite holdings because this is how big gains in your portfolio take place. Peter Lynch, the best mutual fund portfolio manager in history (Fidelity Magellan Fund) averaged 28% returns over a multi-decade career. He did this by investing in growth stocks that he loved (great products with great mgt team) and then holding those positions until the story changed.
Remarkably, Lynch made money on just 6 out of 10 stocks he purchased, over the course of his career. 60% is Hall of Fame on steroids numbers for a baseball player but one might think that the best in the business could do better than a 60% success rate.
Here’s the key to his success; Lynch wrote often that the vast majority of the stocks he bought tended to produce small returns for an extended period (sometimes for years)…he used these pullbacks to add to his positions…because once his favorite stocks began to run, they REALLY took off. Lynch made his big killings in stocks that he owned for 3–4–5 years. By that time, he had accumulated big positions in his favorite companies. And his patience allowed him to crush the markets.
My approach with the VRA is similar to Lynch’s, but a big part of my work is timing the markets to ensure we are on the right side of both short and long term moves. Bottom line; I would rather not have to wait 3–4–5 years or more for my favorite investments to soar. And I really don’t want to lose money on 4 out of 10 holdings.
VRA Portfolio Holdings That Have the Potential to Jump 50–100% + With One “Event”
Having worked on Wall Street for 15 years, I know my personal investment psychology. Over the years my clients came to me because my own style matched theirs. I want to beat the markets, year in and year out, but what I really want to do is absolutely CRUSH the markets. I also know thats why many/most of you are here with me today.
In order to accomplish this, we must buy/hold growth stocks that have the potential to rise 50–100% + in very short order….namely on one “event”.
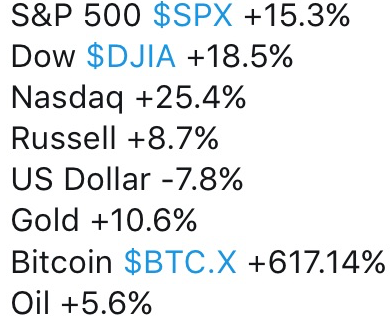
VRA Market Update
Below is a (rather large) screenshot of how various markets have performed through this past Friday. Dow Jones and S&P 500 up about the same (15% and 18%), while the Nasdaq has jumped a big 25% and the Russell 2000 (small caps) pulling up the rear, up just 8%.
The one that gets our attention of course is Bitcoin, up a huge 617%. While I’ve written positively about Bitcoin for years I have never officially recommended it…it does not trade as a stock, and while that’s similar to gold and silver in many ways…I have not yet found a method of investment that would allow me to include it in the VRA Portfolio.
But that should change in early 2018. I received word over the weekend that 2–3 IPO’s will be taking place that will allow us the opportunity to jump on the Bitcoin train, officially. As I learn more I’ll give you an advance heads up. Based on what I am hearing, a February launch looks likely. And no, based on the VRA System I would not recommend buying Bitcoin (or other crypto currencies at todays prices). A shakeout is taking place…we’ll wait until we have better timing…which looks to be a Google-like IPO of a crypto currency system…again, early to mid-February.
What we also see above is the fact that gold has risen some 10% in 2017. Take a quick look at the chart below. We see a most interesting pattern when it comes to December FED rate hikes.
The FED has raised rates twice in December, over the last 2 years. As you can see below, both rate hikes brought with them a huge move higher in gold (and an even larger move higher in the miners).
Following the 12/15 rate hike, gold spiked a big 31% over the next 7 months. Then, following the 12/16 rate hike, gold went on another tear, rising more than 20%in the following 8 months.
See the pattern here?
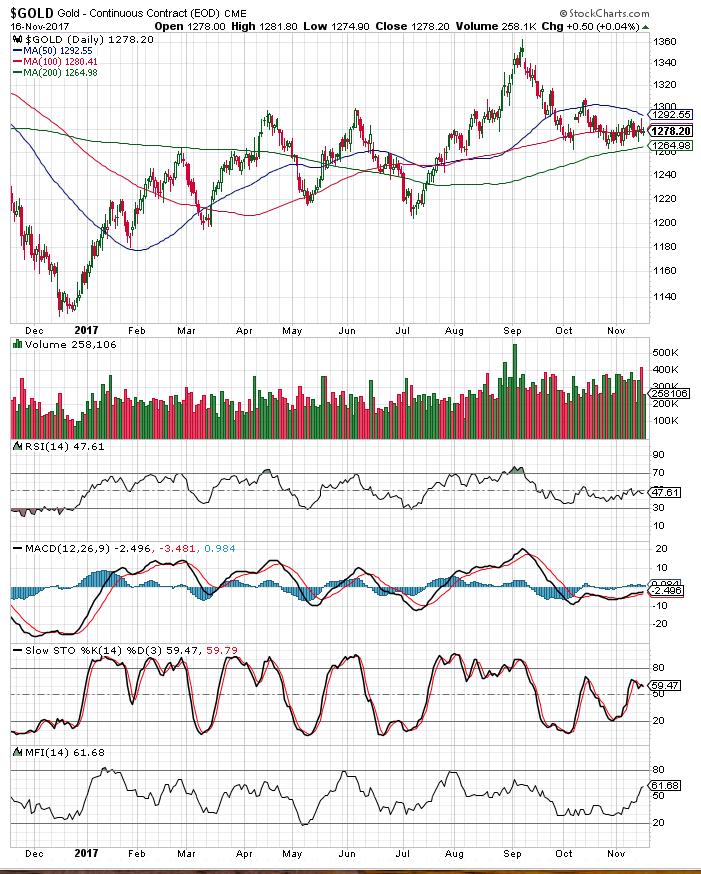
Next up, the FED will almost certainly raise rates at next months meeting. Should gold repeat its past two spikes, which brought an average gain of 25%, the next move in gold will take it from its current price of $1278/oz all the way to $1592/oz.
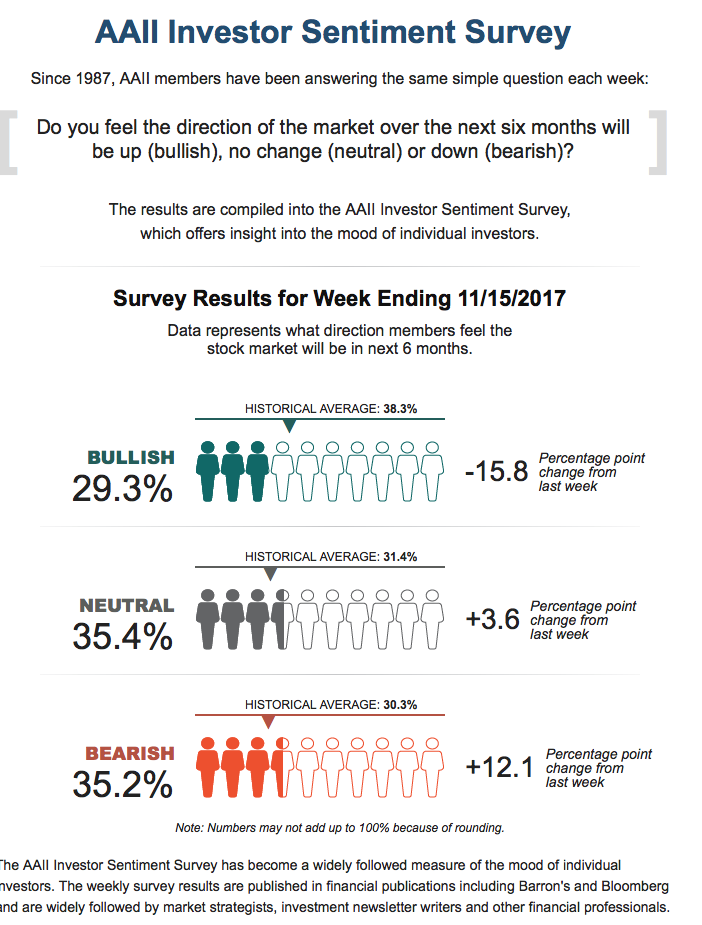
AAII Investor Sentiment Survey
The latest readings from the AAII Investor Sentiment Survey, my go-to sentiment survey for more than 25 years. As you can see, bullish percentage has collapsed back to 29.3%, a huge 15.8% drop in just a week, while bearish investors have surged to 35.2% with neutral investors at an also enormous 35.2%.
And folks, this massive jump in pessimism took place with just a small move lower in the markets. Stunning changes. Let me repeat…this is not how bull markets end…not even close. Bull markets end when bullish % is over 60% for weeks on end. Bull markets end when everyone and his/her mother is ALL IN…and are certain that stock prices will soar going forward. Just based on this reading alone, it is highly likely that this short term pause in the markets is close to ending.
We also got this update on the VIX this Wednesday. The VIX index is also referred to as the “fear index”….a gauge of investor optimism or pessimism. What we see below is that investors are buying the VIX more aggressively than at any point this year, which also means at any point EVER.
Never in the history of the VIX have investors been this bearish. As a contrarian you already know what this means….its almost certainly time to take the other side of this equation…the majority is very, very seldomly on the right side of any trade.

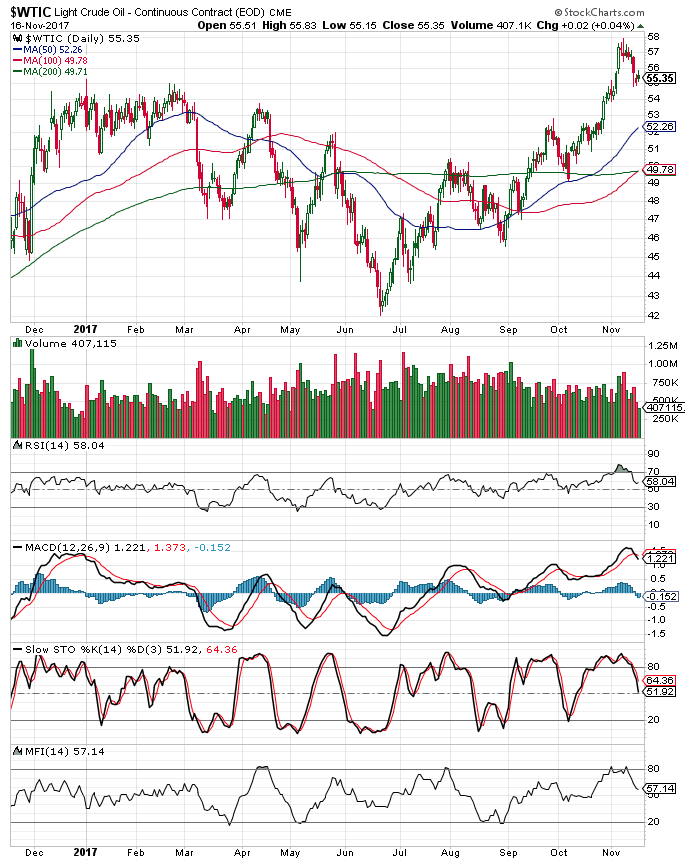
OIL Update
Take a look at this 3 year chart of oil. Besides the major bottom that you see below from 2/16, take a look at the explosion in trading volumes.
My mentors taught me that “volume precedes price movement” and nowhere can that be more clear than the surge in oil trading volume below.
Based on everything that I look at, from both fundamentals and technicals, the price of oil is in a multi-year bull market that might just send oil prices back to the $100 levels far faster than just about anyone is forecasting. We certainly have a Mid East war brewing…the sides have been drawn…Saudi Arabia vs Iran (with allies backing both sides that appear ready for a fight). We are positioned here perfectly.
Until next time, thanks again for reading…
Kip
To receive two free weeks of the Daily VRA Updates, sign up at VRAinsider.com
Reader Comments