
VRA Update: VRA System Analysis. The Bubble Lives On. Dow Jones 25K
 Kip Herriage -VRAInsider.com
 Before we get to the VRA Trading & Investing System Analysis, some observations on "The Bubble" we are witness to today...a bubble that mankind has never seen the likes of...and that just a decade ago would have been too bizarre to turn into a book or movie...no one would have believed $15 trillion in global QE (in only a decade, no less) would even be remotely possible. And, I stopped counting the level of fresh fiat currency printing, fresh debt issuance, about the same time I stopped counting the level of unregulated derivatives outstanding, which topped $1.3 quadrillion (back in 2015).
But folks, this bubble could just be getting started. That's what makes a bubble a bubble...they extend to levels that no one thinks are possible. And right now, with bearish sentiment among investors at such historically high levels (as we see each week in the AAII survey), it's becoming more and more likely to this market observer that global equity markets could soar for Trumps entire first term...an outcome that, intellectually, I still find hard to come to grips with...but bubbles don't work via brain power...bubbles work via bubble power. And this bubble might be a special one....certainly one that still has lots of legs left. If you read my new book, you know that I believed the first 2 years would be rough for Trump. While this could still be the case, outisde of ordianry pullbacks and corrections, I see none of the tell-tale signs that would mark a more serious decline (unless of course we factor in any of the global, ever present, black swans).
Back in late 2014, When the Dow first crossed 18k I began writing about the very real possibility of Dow Jones 25k by the end of 2018, and while there's no one on the planet that knows what the future holds (making my conjecture mostly a silly exercise), a fresh look at some of the most important facts....plus the VRA System Analysis...should help us.
As we go through this, know that the Dow is up just over 240 points as I write, back above 21k and just 60 or so points away from another fresh all time high. Based on the action we are seeing, unless the markets completely reverse course just prior to a new high, the benefit of the doubt has to go to "The Bubble" and its ability to live on. This market is bulletproof...using every pullback to suck in the bears...which only pushes the market higher, as they are once again forced to cover.
Remember the Trump fears from folks like Mark Cuban and 80% of Wall Street soothsayers? The Dow could drop 10%....20%....it might even be cut in half? Uhhh....nope.
How about the fears of Brexit and the global collapse that would take place, should the UK bolt the EU. Nope....
Then this weekends first round in France....for the first time in modern times, neither ruling party will have a candidate in the final run-off come 5/7. But do stocks collapse. Nope...they scream higher...while at the same time, bond yields barely budge.
This is a one of a kind bubble...one that might wind up being bigger than just about anyone can imagine today.
As we know all too well, central banks appear, well...there's really only one word for it...desperate. First, they continue to pump stock prices higher and higher. They do this both directly and indirectly. Directly through either straight up equity buying (as in Japan and China and God-only-knows how many invisible hands the FED employs elsewhere around the globe), but also indirectly via their purchases of corporate debt (in Japan, China and all throughout Europe/the EU, plus once again, the FED's invisible hands). These corporate bond buys by global central banks then serve as a proxy for corporations to continue buying back their own shares at record levels. Rinse and repeat. Rinse and repeat.
This is the essence of our global central bank shell game. It kicked off in earnest following the 07-09 financial crisis and has only picked up serious steam from there.
With interest rates remaining unbelievably low this late in the cycle, its also clear they want rates to continue falling. There is simply no evidence to the contrary...at least until the bond market vigilantes mark their return from a 32 year hiatus.
What makes these low rates so remarkable...with the 10 year yielding just 2.3%...is the chart of the housing index that we have focused on recently. Heres an updated 11 year chart of HGX, which hit another 11 year high on Thursday....showing absolutely no signs of wanting to reverse.
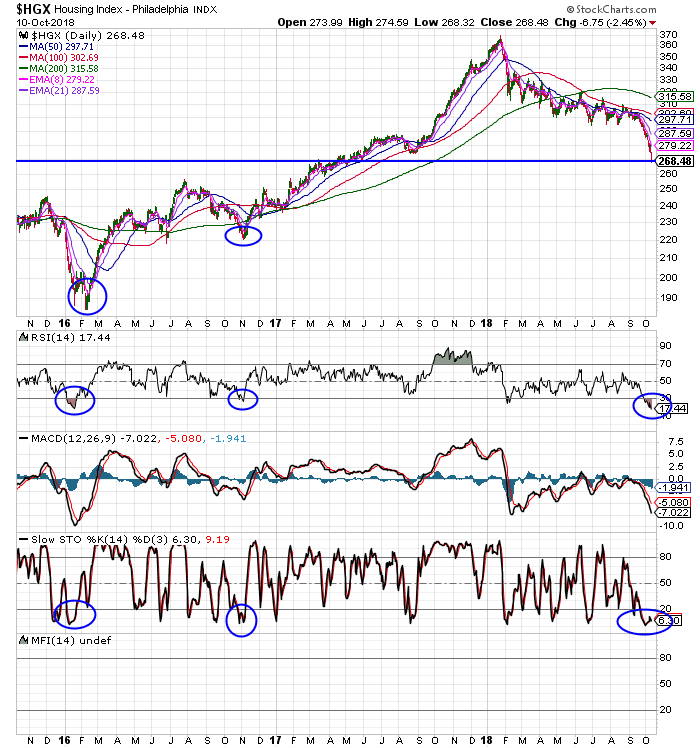
And with the king of real estate & debt in the White House, it might make perfect sense that we should have another 2-3-4-5-? years of real estate bullishness. Hey, your guess is as good as mine...but this next part is not a guess; economic recoveries do not end when real estate is flying high...it's simply not the way it works.
Of course, a world war with Russia/Iran/North Korea (China)...one that might even include a few nukes...would bring this party to a crashing halt overnight...these are the scary as hell black swans we are forced to live with.
Let's wrap this up with the things that I can speak much more confidently about...the VRA System and some chart work:
I normally point to the chart of the S&P 500....now, lets take a look at the Dow Jones.
The breakout that began on Monday took the Dow out of its flag pattern and it did so with a positive resolution. The bears had their chance and once again, they look to have failed.
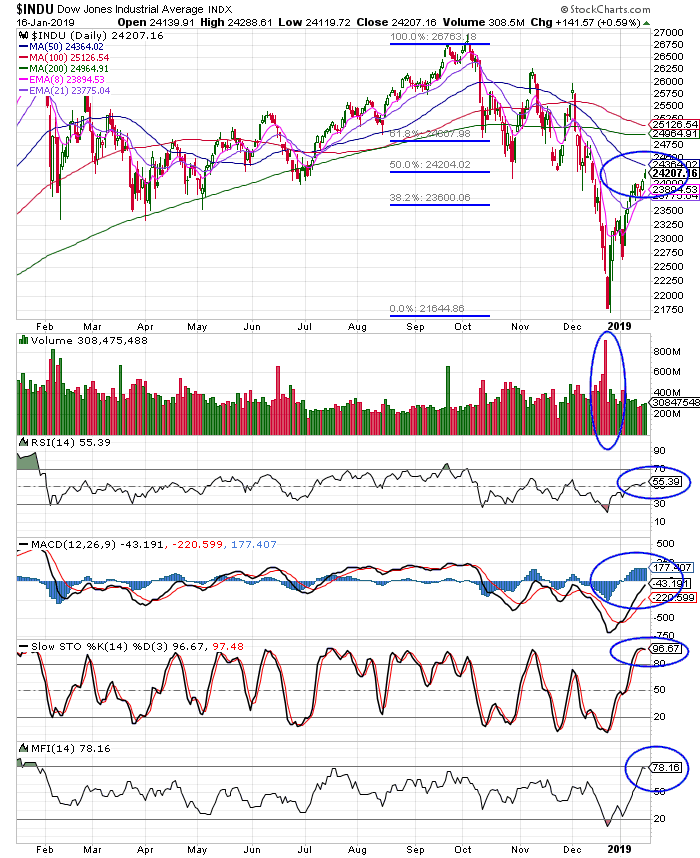
While still a few points below a new high, the Dow looks ready to take the old highs on and easily surpass them as well. The Dow just got a fresh buy signal as well, with the MACD turning bullish, all while the oversold levels are now reversing....also giving a fresh buy signal on RSI. Still fully bullish, based on my VRA System (which has remained LT bullish since 2012).
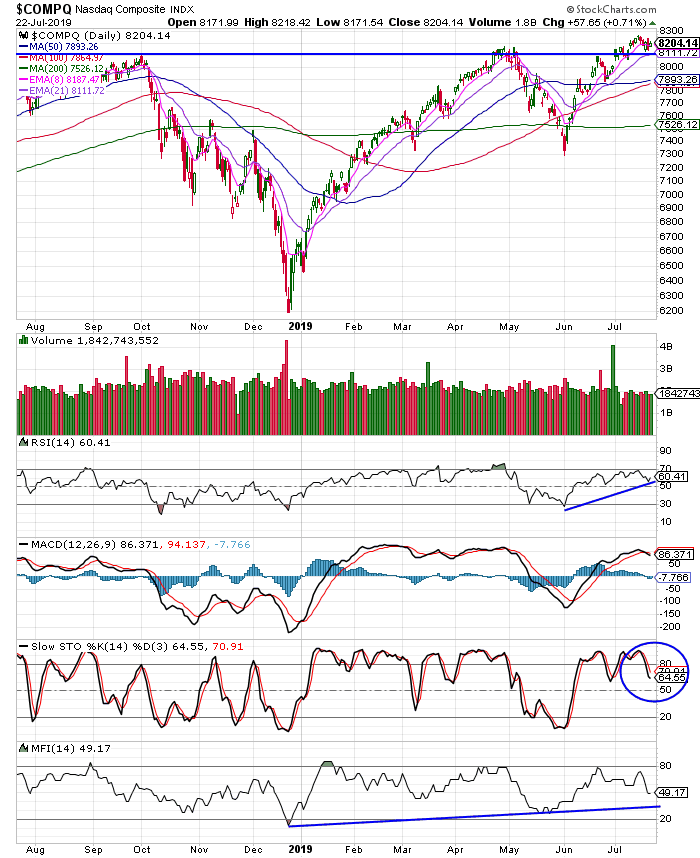
But its this next chart that has people talking....take a look at the Nasdaq:
That circle you see represents todays 73 point move higher from yesterday, to another fresh all time high. My mentors taught me that a soaring Nasdaq represented a "sexy market" that wants to push higher. The chart below qualifies as sexy...with the kicker that we also got a fresh MACD buy signal today as well.
But, at the same time, check out yesterdays CBOE Put/Call ratio. The Dow never really fell below +200 points, but remarkably, investors were buying puts all day long. Anything over 1 means investors are bearish...and it actually closed the day at 1.05, the highs of the day.
| TIME | CALLS | PUTS | TOTAL | P/C RATIO |
|---|---|---|---|---|
| 9:00 AM | 497582 | 491981 | 989563 | 0.99 |
| 9:30 AM | 749706 | 696825 | 1446531 | 0.93 |
| 10:00 AM | 1022265 | 949984 | 1972249 | 0.93 |
| 10:30 AM | 1153216 | 1138855 | 2292071 | 0.99 |
| 11:00 AM | 1303276 | 1322000 | 2625276 | 1.01 |
| 11:30 AM | 1466704 | 1468224 | 2934928 | 1.00 |
| 12:00 PM | 1642180 | 1644805 | 3286985 | 1.00 |
| 12:30 PM | 1730765 | 1734456 | 3465221 | 1.00 |
| 1:00 PM | 1859668 | 1833885 | 3693553 | 0.99 |
| 1:30 PM | 1959914 | 1982897 | 3942811 | 1.01 |
| 2:00 PM | 2095219 | 2093368 | 4188587 | 1.00 |
| 2:30 PM | 2264818 | 2309353 | 4574171 | 1.02 |
| 3:00 PM | 2456804 | 2578754 | 5035558 | 1.05 |
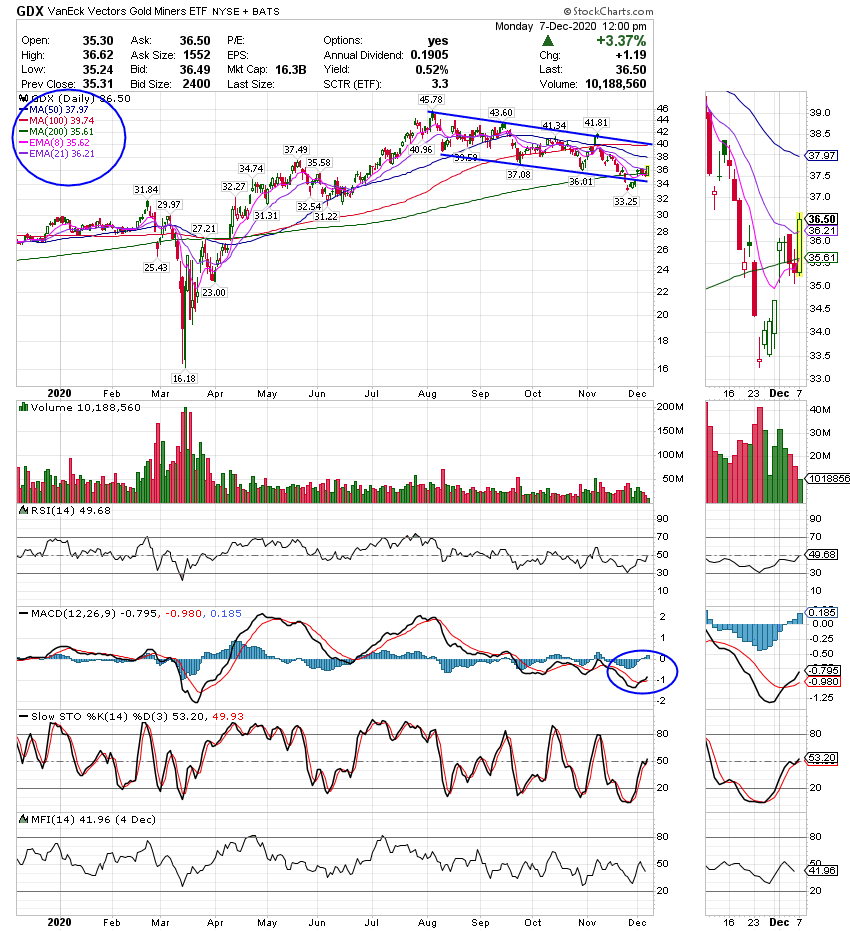
We looked at gold last....still giving a strong buy signal above all important technical levels....so lets look at the mining ETF, GDX.
While still overtly bullish, from those early 2016 lows, the miners refuse to fully participate with gold/silver. Of all the charts that I follow, its the miners that have me most flummoxed. The fundamental story could not look better. Record global debt levels....rapidly rising real inflation levels...ungodly amounts of fiat currency printing...but the miners have yet to really come to life.
But when we look a bit closer, we see a rising bullish wedge/triangle...one that I believe MUST result in a massively sharp move higher, as "The Bubble" continues along its merry way. Folks, the bubble that we are living through today tells me one thing; gold and silver...and most certainly the miners...are about to join this party. Here's what I believe we will see next; GDX will break through the upper trend line, then its 200 dma, which today sits at $24.54...and what follows will be a monster move higher.
The consolidation that we are seeing today will serve as a "coiled spring"...yes, this is an actual technical term...with the miners breaking to new all-time highs. This bubble demands it!
We buy them when they are cheap, so that we may profit from them when they are no longer cheap. This is the ONE group that every smart money investor I know and trust is buying...for spectacular LT gains.
Finally, my stock of the century (VRA Subscribers) is holding onto 2.5 month gains of more than 300%. I will issue a clear heads up on the next move higher...it will be a remarkable ramp. Continue to dollar cost average.
Until next time, thanks again for reading...
Kip
Reader Comments