
Anatomy of the VRA Investing System. Crushing the Market. A Case Study From the Recent Market Correction.
 Kip Herriage -VRAInsider.com
 The VRA System was built to remove emotion from my investing. It was built to have us out of the markets in times of turmoil (or short) and in the market when the bull wants to run. We used the VRA System to book 150%+ in net gains from last September through January/February of this year, when we were stopped out. We avoided much of the pain from the 12–13% correction, as we went to cash on our broad market positions.
But all of that changed at the end of March. The VRA System compelled us to go long, once again.
Anatomy of the VRA System
The VRA System combines fundamentals, technicals and investor sentiment…the 3 most important elements of investing (in any/all asset classes).
Lets first take a look at the technicals. As we’ve covered here often, the double bottom we’ve just experienced is highly bullish and will serve as a springboard for the next major advance.
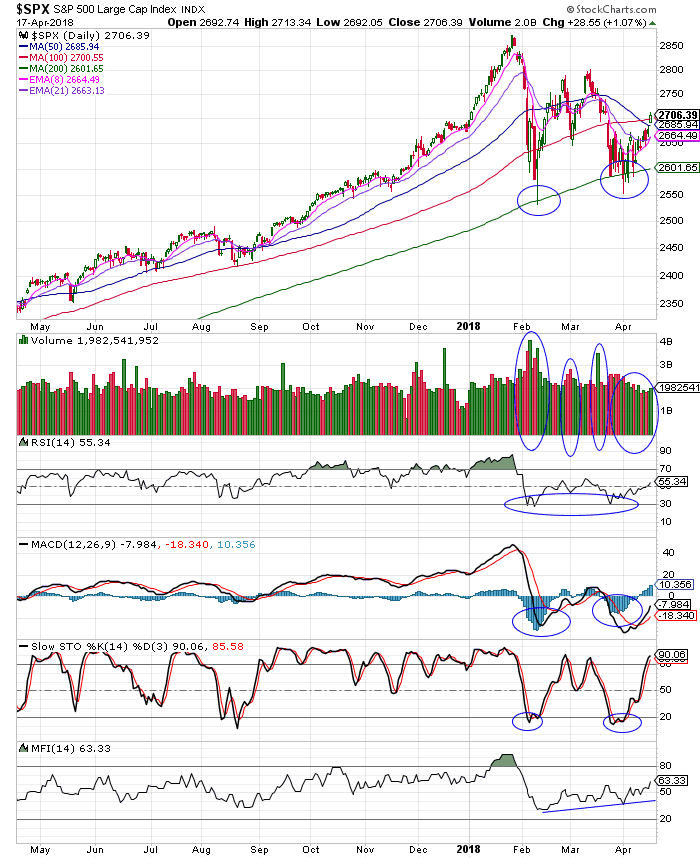
Here’s the 1 year chart of the S&P 500, the largest and most important stock index on the planet. Compare the points below (circled) to my comments.
1) While not a perfect double bottom (the Dow Jones was close to perfect), we see a .10% difference between the February and April lows. Double bottoms (that hold) are ultra bullish. This was, in fact, a “higher low”. Most bullish.
2) Importantly, the lows also occurred on declining volume. If volume had increased on the second bottom, it would have almost certainly sent the S&P 500 to new lows. If you see someone that says “volume does not matter”, know that you are listening to an investing charlatan. Volume analysis is a most important tool…one that I have used for 3 decades in technical analysis.
3) The S&P 500 held the 200 day moving average (dma) on each test. Had the 200 dma not held, we would likely be short the market today…rather than long and strong.
4) RSI (Relative Strength) never broke 30. Instead, it held this most important level twice…another double bottom retest.
5) MACD flashed a much less severe reaction to the second sell-off….another positive divergence that told us the lows were likely in place. It’s own “higher low”
6) Stochastics flashed a double bottom “heavily oversold” reading of 83%, on both occasions.
7) MFI (money flows) flashed “higher lows”….the upslope from the 2/9 lows told us that smart money investors (thats us) believed the lows would hold and it was time to “buy aggressively”…just as we did.
By learning the 3 most important sides of smart money market analysis (fundamentals, technicals and sentiment), for the rest of your investing days you will be able to apply this knowledge, enabling you to time the markets as well as individual stocks/ETF’s.
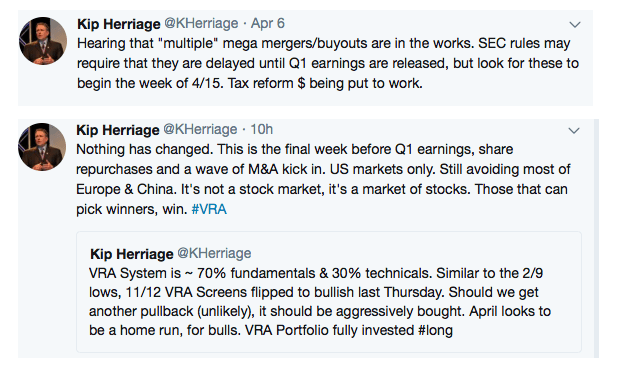
Heres a segment from our late March, early April VRA Updates on the fundamental reasons that we have remained bullish. It covers all of the bases.
As you know, I am bullish on the broad market (I’m even more bullish on our VRA Portfolio). We look to have double bottom lows in place, just as Q1 earnings are about to kick in. That’s just one of many reasons I’m bullish.

Should the lows be in place, those that are bearish on Trump, and out of the markets, will be forced to begin buying back in at higher prices. Those that are short, will be forced to cover (and then go long as well). And those huge numbers of put option buyers will be forced to sell those puts and then buy calls.
We look to be set up beautifully for a rocket-ship like move higher. When all 3 components of the VRA System line up (the fundamentals, technicals and investor sentiment), we must be long. Period.
We will look back at this time frame and realize a golden opportunity was staring us right in the face.
Major VRA System Points of Interest:
1) By Wednesday of next week, more than 150 S&P 500 co’s will have reported earnings. 90% of all earning reports will be out over the next 3 weeks. Earnings will be sensational…I expect CEO comments about Q2, Q3 and Q4 earnings will be rock solid as well.
2) The forward P/E multiple on the S&P 500 is now 16.3. Just 18 months ago it was 23. 12 months ago it was 20. Do you see a trend here?
Earnings growth of 15% is driving down P/E multiples to their lowest levels in years. Value investors have no choice but to find this overwhelmingly bullish…even the Trump haters must admit that an earnings revolution is taking place. US economic strength is powering ahead…and tax reform is only now making its way through the system. If you are underestimating the power of Trumps tax reform, you will likely miss one of the quickest surges in US economic growth, in history.
3) Once earnings are announced, reporting co’s are allowed to continue their share buyback plans. According to SEC rules, there is a roughly 5 week period (before earnings are announced) that prevents co’s from repurchasing their own stock. The market has missed this demand. Remember, it’s estimated that total buybacks in ’18 will top $850 billion, an all-time record times 15–20%.
4) Look for mega sized mergers and acquisitions to be announced during the 2nd quarter. $30 billion to $80 billion + in size. Again, tax reform is the reason. Some $4 trillion is headed back to the US financial system.
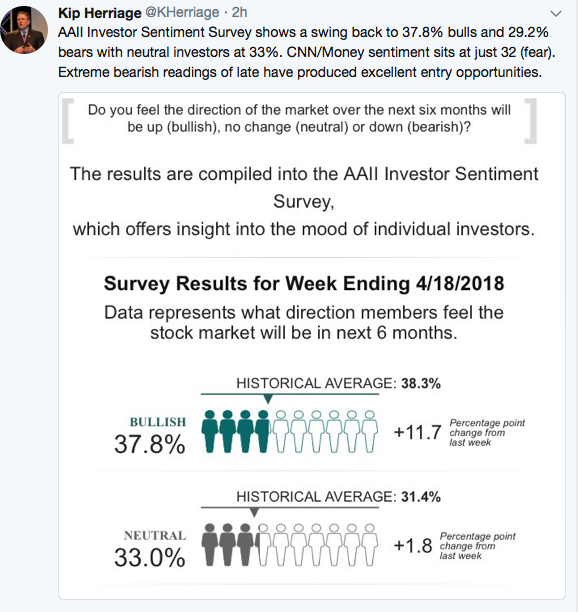
5) Finally, according to the VRA System, investor sentiment continues to flash “buying opportunity”. Bearish sentiment is at extreme fear levels, while the markets remain in “confirmed bull market” status. On Friday, the TRIN closed over 2.5 for just the 3rd time in the past year. This signals “investor panic”. As contrarians, we MUST use this as a buying opportunity.
— -
Late last night we got the latest investor sentiment readings from AAII. Looks very much like the two year lows in sentiment, from late March, matched up exactly with the correction lows.
No system is perfect. But I’ll put the VRA System up against all comers. I believe the results speak to this. Combined with our small cap VRA Portfolio holdings, in my view, we could not be positioned better today.
The VRA Portfolio has 2400%+ net gains since 2014.
Until Next time, thanks for reading…
Kip
Reader Comments