
The Importance of Relative Strength. EM, China, GDX. VRA Market, System Update.
 Kip Herriage -VRAInsider.com
 Good Friday morning all. Parabolic Options #8 closes today. This will be our largest options program we've done to date. Cannot wait to crush Mr Market with you. We'll close signups today and send out our first test email and texts early Saturday morning. Any questions, we're always here. To learn more about the program visit : Parabolic Options Program
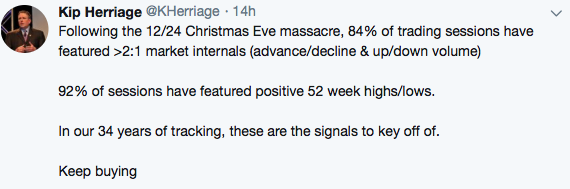
Yesterdays trading brought our first back to back negative days for VRA Market Internals since the 12/24 Christmas Eve massacre. Still, even with a -220 Dow Jones, new 52 week highs outnumbered new 52 week lows by 187-132. Watching closely as always but this looks very much like an overbought pause, in an otherwise powerful, continuing uptrend.
Hockey great Wayne Gretzky famously said "skate to where the puck is going, not where its been".
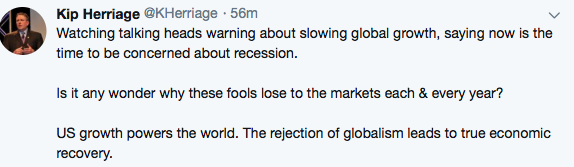
If you watch MSM financial news much, its impossible not to hear about the global slowdown occurring in Europe and China. Please, tell us something we don't already know. Could it be that this is why global markets fell 25-50% in 2018? Could it be that the slowdown is already priced into some of these badly beaten up markets?
This is why we place so much importance in tracking relative strength. Its a unique look at where the puck is going, yet few seem to use this most valuable investing tool today. Thanks again to my mentors from the 80's and 90's (RIP Ted Parsons and Michael Metz).
Lets look at a few examples this morning (my relative strength charts are versus the S&P 500, the worlds largest and most important equity index):
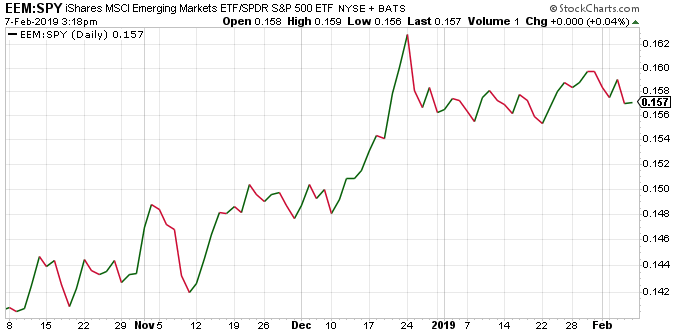
1) EMERGING MARKETS (EEM).
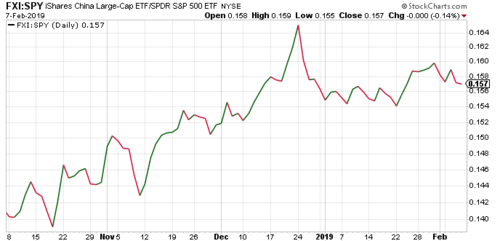
Again, if you listen to the news you'd probably want to short EM/China. But look at this dramatic, 4 month outperformance of EM to the S&P 500. As much as the S&P 500 has soared from those 12/24 lows, EEM has outperformed by 12%. Thats some serious alpha. But the "gurus" want little to do with EM/China. Their loss....again.
VRA Market and System Update
The January barometer is another piece of important analytics that long time market watchers have used for decades. Check it out; we know that we just had the best January since 1997, with S&P 500 gains of 5.62%. What does this mean for us?
As goes January, so goes the year....this is the heart of the January barometer.
Between 1950 and 2017, the January barometer has been correct 58 of 67 times, or 87% of the time. Powerful statistical analysis.
Lets also remember that in years following mid-term elections, since 1946, the markets have been higher 18 of 18 times, with an average gain of 15%.
Folks, and forgive my repetitiveness here, but we must continue to ignore the permabears and negative Nancy's. No, we are not headed into recession. No, the sky is not falling. And yes, we remain in a super bull market that will take the Dow Jones past 35,000 by the end of next year and past 50,000 by the end of Trumps second term.
While we remain short term overbought, the time to aggressively buy was in mid-late December, but also know this; we continue to expect that any pullback will be merely an overbought pause. We see it in the data and we see it in VRA internal tracking metrics. US stocks are building momentum. Much higher prices await.
If you've been able to listen to our end of market daily podcasts, each day you hear us get into the mechanics of the markets. The backbone of the VRA Investing System. We're big believers in the KISS principal. With all of the insane attempts by todays day trading technicians, who think they can time the markets from day to day, we take a bit longer term view. Watching the internals and the VRA System Screens have kept us on the right side of big moves.
Please join us daily at vrainsider.com/podcast
While we remain at 8/12 screens bullish, I look for this to jump to 9/12 in the near future. Remember, anything above 6/12 bullish screens and we're still buyers. The Dow Jones is back above its all important 200 dma, with the S&P 500 and Nasdaq hot on its tail.
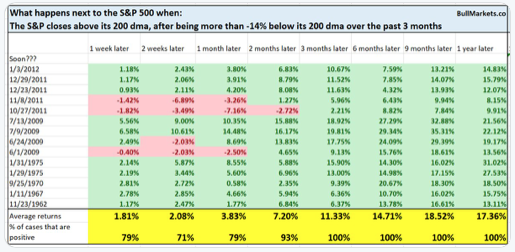
Check out this excellent work from our friend Troy Bombardia, master of market analytics. What we see below is what happens to the S&P 500 when it closes above its 200 dma after being more than 14% below its 200 dma for the previous 3 months. Stunning figures here, including an S&P 500 that is higher 100% of the time over the next 3-6-9-12 months, with an average gain of 17.36% a full one year later.
Long and strong...don't let the bears convince you of anything else.
Until next time, thanks again for reading...
Kip
Since 2014 the VRA Portfolio has net profits of more than 2300% and we have beaten the S&P 500 in 15/16 years.
Experience the Vertical Research Advisory free for 2 weeks!! For a limited time we are offering a 2 week free trial to the Vertical Research Advisory, visit vrainsider.com for more details.
Reader Comments