VRA Portfolio +38.3%, Crushing Mr. Market. VRA System Update. The Fed Goes Full Dove. If You Are Not Long, You Are Wrong.
 Thursday, March 21, 2019 at 11:32AM by
  Kip Herriage -VRAInsider.com
 Good Thursday morning all.
With just over a week to go in Q1, here are our updated VRA Portfolio results:
VRA Portfolio: +38.3%
S&P 500: +12.7%
VRA outperformance (vs SPX): +292%
VRA annualized return: +152%
We only own 10–12 stocks at any one time. We want a focused/concentrated portfolio, one that we can apply monthly dollar cost averaging to, allowing us to build sizable positions. We want to crush Mr. Market (make no mistake, he loves crushing us).
VRA Market/System Update
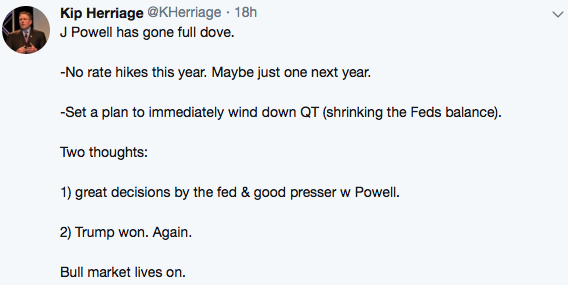
Yesterdays Fed meeting has the “recession is coming” permabears out in full force (again). J Powells Fed effectively admitted that 9 straight rate hikes was a mistake (Trump was right). Powell also announced plans to cancel QT, or quantitative tightening (Trump was right). And Powell announced that the Fed would not hike rates again this year, with just one hike likely by end of 2020 (Trump was right, again).
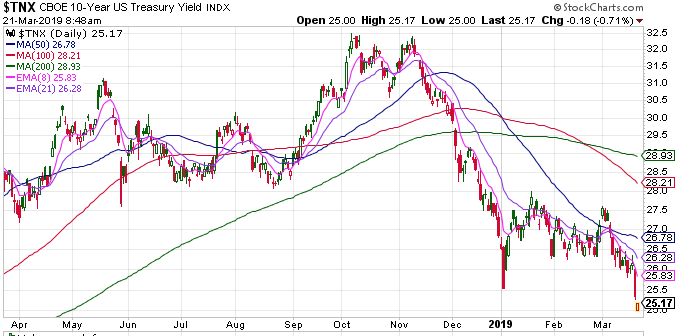
We continue to find the bears negativity remarkable. The VRA Investing System remains at 10/12 screens bullish. But, the bears are fixated on this chart….10 year yields…which have now crashed to a new annual low of 2.5%. To the bears, this signals “recession” is nearing. Trust me, we are watching this closely as well. But just as we told you last year that rate hikes would end, we’re telling you now that a 2.5% 10 year is not the sign that recession is nearing.
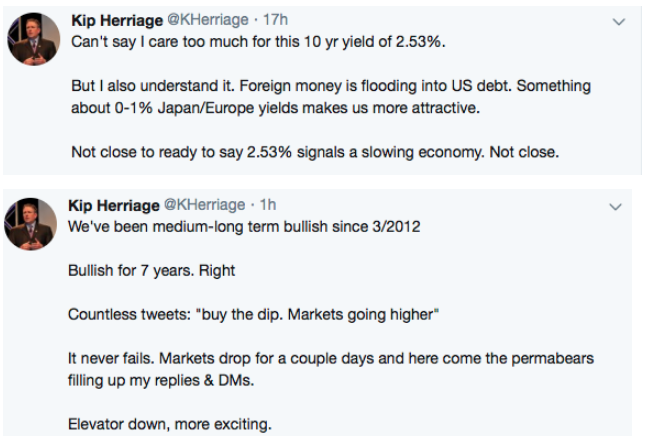
Know this; foreign money is flooding into US debt markets. With 0–1% govt debt yields in Japan/Europe, who can blame them. 2.5% in US govt debt is a slam dunk! Important news that we’re barely hearing in the financial MSM.
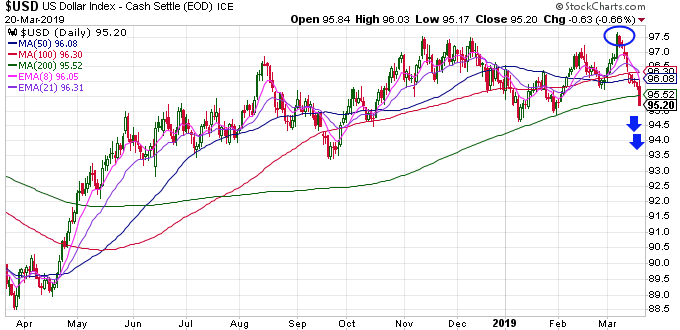
US Dollar
3 weeks ago we told you that the US dollar breakout was likely a false breakout. The ramifications of a lower dollar are bullish for the VRA Portfolio positions in precious metals, miners and oil/energy stocks.
You know our thoughts. Dips must continue to be bought. US and global markets are headed much higher.
We see more technical evidence of this (below) in the chart of the Dow Jones. Last week we focused on the inverse head and shoulders pattern in the S&P 500. Low and behold, we see an inverse head and shoulders in the DJ as well. Not as perfectly defined as we saw in SPX, but an inverse H&S none the less (marked by small blue circles at top right).
But here’s what we’re focused on right now. The DJ just experienced a golden cross. A golden cross occurs when a short term moving average crosses over a longer term moving average. There are many types, but the most bullish (by far) is when the 50 dma crosses the 200 dma.
Personally (and this is backed up by data as well), I find golden crosses more useful in individual stock patterns. But folks, anyone that tells you a 50/200 golden cross is not a useful tool is almost certainly a permabear. Either that, or they’re just trying to play devils advocate. We’ve had 5 golden crosses in the DJ over the last decade. Each has produced higher prices over the next 6–12 months.
Check out how the DJ did following its last 50/200 golden cross, in April, 2016. What we see below is a 50% move higher, from the April ’16 golden cross to the peak in October of last year. So yes, golden crosses are a valuable investment tool.
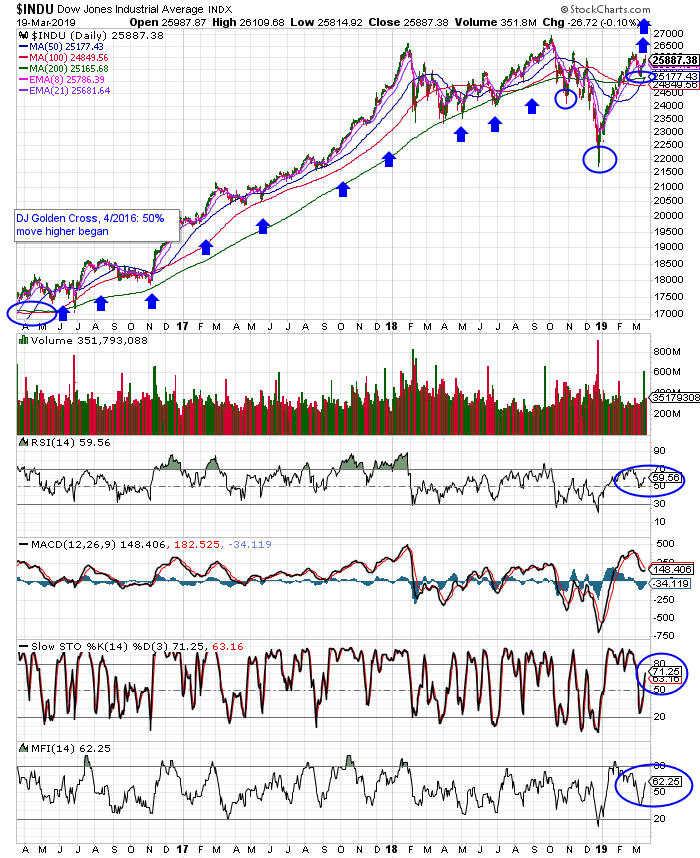
What we also see above is a full on buy signal in the DJ, according to the VRA Investing System. Each technical signal (RSI, MFI and stochastics) is flashing buy. We should get a fresh MACD buy signal in the next 1–2 days as well.
If you’re not long you’re wrong.
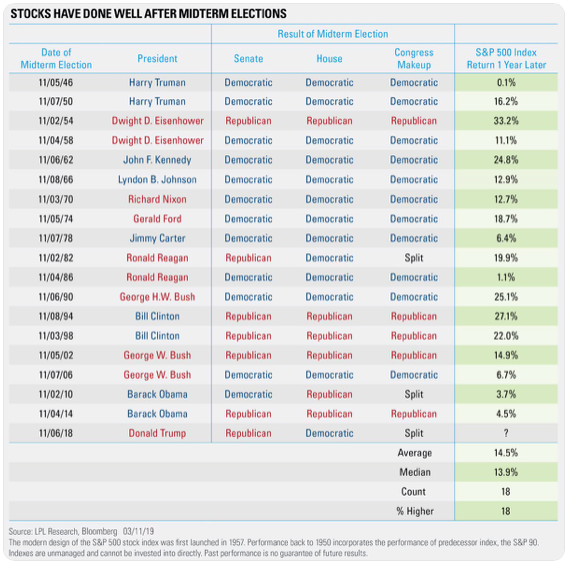
If you were with us last October, you’ll recall this chart and market analytics.
Since WW2 (1946), the S&P 500 has been higher 1 year after the midterm elections “every single time”. That’s 18/18 with an avg gain of 14.2%. Currently, the SPX is up just 2% following the midterms. We like repeating patterns a great deal. Most certainly those that have been 100% accurate since 1946.
One more time, for about the 105th time since Trump was elected, “if you’re not long, you’re almost certainly very, very wrong”.
Until next time, thanks again for reading…
Kip
Since 2014 the VRA Portfolio has net profits of more than 2300% and we have beaten the S&P 500 in 15/16 years.
Learn more at VRAInsider.com

Reader Comments