Journal Archive

"Kip's VRA financial newsletter is a MUST read for every saavy investor in this country. Disregard it at your own peril. His mantra is my mantra. Kip Herriage's newsletter is my financial Bible."

--Wayne Allyn Root
2008 Libertarian Vice Presidential candidate
Author, "The Conscience of a Libertarian"

SUBSCRIBE TO OUR BLOG!

* indicates required
Twitter: @kherriage

Entries in vraletter.com (51)

Thursday
Jun072018

VRA Update: Nailed it. Steroid-like Move Higher, Melt-up. VRA Market/Portfolio Review. 68% Average Gain on All VRA Buy Recommendations.

Good Thursday morning all. Another big green day in US and global stock markets as bears capitulate, by covering their shorts, and then add to the already surging buyside volumes by then going long themselves. This is the nature of how a big move higher in the stock market occurs…this one looks to be just getting started.

VRA Market/Portfolio Update

Another big move higher in the markets yesterday. If you’ve been able to join us on our end of day podcasts (sign up at vrainsider.com/podcast), you heard the following: yesterdays new highs to lows hit 859–172. Stunning broadening action. It also marked back to back to back days of 5–1+ readings.

Last time we saw this? Early January…just prior to a 1300 point move higher in the Dow Jones.

But…VRA System readings are getting stretched. Take a look:

Nasdaq: 97% overbought. Extreme readings…however, MFI and RSI still have a ways to go (avg of 73%).

Russell 2000: 96% overbought. Extreme as well…however, MFI and RSI have a ways to go (avg of 72%).

S&P 500: 92%. Extreme as well…however, MFI and RSI at just 50% avg.

Dow Jones: 69% overbought. Room to run. MFI and RSI 46%. The DJ…the most trade-centric of indexes…is in fine shape, which helps to explain why it is now leading the way…playing catch-up.

Bottom line: while I fully expect the move higher to continue, this is almost always when investors get greedy…when they make mistakes. No need to sell…no need to be overly concerned…but absolutely the time to pick our spots more carefully.

Note: Trump is KILLING it on trade. Wilbur Ross, Commerce Secretary and self made billionaire himself, is the freaking man.

We’re seeing some serious broadening patterns take place. There is no more bullish a market. But no…we’re nowhere as cheap as we had been.

This brings us to GDX (Miner ETF). And this chart.


From the initial breakout higher, which the VRA nailed pretty much to the day back in January 2016, GDX went on a tear, rising some 145% over the next 8 months. Then, it crapped out. Hit a big wall, which I completely missed. The result has been the 18 month sideways pattern you see below.

But its not all bad. This sideways action is one of the biggest coiled springs you’ll see. Should it break higher, which I fully expect, we’re looking at a measured move to something like $50 on GDX…or 120% higher than todays $22.50.

But first, we need a move back over the 200 dma. It’s close…just .25 away. Following that, and this will be the real kicker, we want to see GDX top $25/share. When this happens, look out above. And yes, these moves need to take place on volume as well.

Next up, take a look at this chart of oil (USO, Oil ETF). If you like channel trading (I do) and if your like probability investing (I do), oil looks like a screaming buy here. If you wanted to play this for a move higher you may want to use OILU (3 x Oil ETF). OILU has collapsed 25% in just 2 weeks. If my global reflation trade theme is accurate, and with the US dollar looking top heavy (oil is priced in USD), OILU could be an interesting short term play. We’ll take a closer look a bit later.

As a reminder, we use the VRA System to ensure we are on the right side of the market, and in the right sectors, primarily through the use of leveraged ETF’s. Leveraged ETF’s give us the greatest bang for our buck (up to 3 x times the move in broad market ETF’s) while removing the risks of owning a single large cap stock, where anything and everything can go wrong.

However, instead of putting on a new leveraged ETF position…like OILU (3 x Oil ETF)…we will be a bit more patient. We use leveraged ETF’s profit from broad market moves, while our small cap growth stocks give us our opportunity for 100%…300%…1000% moves higher. We’re watching a couple of additional small caps that could be added next. So, we’ll keep our 3 leveraged ETFs in the portfolio now without adding a new position here.

Our goal is to own 10–12 positions, max, giving us the ability to own larger position sizes than would be the case otherwise. This is how we crush Mr Market. Plus, once PM’s and the miners break out, we want to have room to add more back to the portfolio. This is my thinking.

Until next time, thanks again for reading..

Kip

Thursday
Apr052018

VRA Update: Rally Caps Engaged. Double Bottom, 800 point DJ Surge.

Fear and greed moves the markets, most certainly at extremes, and have we ever seen plenty of fear and greed over just the last few days. The MSM flipped from wall to wall coverage of “Russia Russia Russia” to “China China China”, and as usual, scared many investors into panic selling their positions.

For our VRA Members, as we covered yesterday, panic is not an investing strategy. Instead, and in high likelihood, the markets lows are now firmly in place.

When we can time the markets well…and while never perfect, the VRA System gets us out near the highs and back in near the lows…leveraged ETF’s on the most attractive market sectors (again, according to the VRA System) gives us the ability to beat Mr Market. I have no other goal, with the VRA Portfolio.

With a clear double bottom (and near perfect retest) now in place, this is when the smart money has a clear and distinct game plan. This is the time to be heavily invested in the broad market. With Q1 earnings, share repurchases and M&A activity directly ahead….all positives and due in majority part to Trump’s tax reform…now is the time to be long and strong.

Our exit strategy is clear; we are heavily long, expecting a surge higher, and will only take profits in 2 situations; 1) the markets reach extreme overbought levels and then begin to show internal weakness or 2) the markets instead reverse and take out their double bottom lows.

I continue to expect higher prices…we are well positioned.

I also want to give a shout out to my very good friend Wayne Allyn Root for his tweet from yesterday.


In my view, this is the reality that the markets are waking up to. We have few reasons to be fearful of China…but China has MANY reasons to be fearful of the US. Among the replies to Wayne’s tweet, the most common reply from Twitter trolls went something like this: “oh yeah? Doesn’t China own all of the US’s debt? If they stop buying, the US economy will crash!”

It’s a common misconception. First, should the US government debt market implode, China would implode right along with it. A more symbiotic relationship, there is not. And second, heres the list of the largest US debt holders. Chinas on it….but at $1.2 trillion, their total holdings make up less just 5% of all govt debt outstanding.


And I’ll repost this tweet as well, for our newer VRA Members. If you have not seen The China Hustle, I highly recommend giving it a gander;


Folks, this is why China has never been included in the MSCI emerging market index, despite China making up 90% of all emerging market equity capitalization. Should we get another sharp sell-off, China tariff related, think back to this VRA update and use it as a buying opportunity. We’ll crush China in any trade war…of course they know this…which is why there will not be one. Bank on it.


FEAR OF MISSING OUT (FOMO) is back on. From Mondays opening 700 point lows, this was my view…it remains my view…and then some:


Will we have another 2000 DJ move higher, over the next 10 days as well? If I told you I had that answer you should never listen to a word I say, ever again, but I am confident in saying “its certainly possible”. The combination of fundamental and technical positives line up very, very well.

Yet, just this week we’ve seen numerous market timing gurus switch from bullish to bearish…right at the lows…remarkably, according to the VRA System. They clearly do not have access to VRA momentum screens:

With current US economic strength, we see no signs of an impending recession. Instead, we see signs that the US economy is on track for a full year 3% GDP, at minimum.

Market corrections are never a fun experience. With a bit of good fortune, we’ll survive the current one and get into the heart of Q1 earnings season next week. This is when US share repurchases can resume, a major driver for higher stock prices (matched with lower supply).

The lows are in place. It’s time to be highly bullish, once again.

Until next time, thanks again for reading…

Kip

To receive access to our full VRA Membership and daily updates(including our VRA Portfolio with buy and sell recommendations, featuring 2400% net gains since 2014), sign up to receive two free weeks from the VRA at www.vrainsider.com/14day

Also, find us on Twitter and Facebook

Tuesday
Feb272018

VRA Update: Do Not Fight the Tape. VRA System Approach To Crushing the Market. Investing Comes at You Fast.

Good Tuesday morning all. After Monday’s big close I continue to be amazed by the bears that somehow appear blind to whats occurring in the US economy and stock market. Our long time VRA Members know how bullish I am…how bullish I’ve been since Trump was elected and made it out of the historically dangerous first year of a new presidency.

My mentors taught me a few things well…chief among these was “do not fight the tape”. Todays stock market bears obviously had inferior mentors. Both the macro environment and the structural set-up of this powerful bull market continue to scream “higher prices ahead”.


One month ago, the VRA began writing (daily) that the internals were breaking down. To protect ourselves we placed some tight stop losses on our most exposed positions to a market correction. As the market plunged 10% in less than 8 trading sessions, we were stopped out of some positions….combined (over the last 4 months) the VRA has booked 167% in net profits (24% average per position) and we then used the 10% correction to re-enter the markets.

This is how the VRA System works. We are quite likely the most unique investment advisory you’ll find, as our objective is simple; make money for you…our valued clients…as we crush the markets, month after month and year after year.

I highly encourage our newer VRA Members to read (re-read) our VRA Update from Friday. It explains our approach to beating the markets, using the VRA System, ETF’s and “Story stock” growth stocks, which produce gains for us of several hundred percent to more than 1000% percent.

Obviously, to make money in the markets, we must be on the right side of big moves. We nailed last weeks huge rally in stocks, punctuated by the 650 combined point move higher in the DJ on Friday and Monday. Remember, we are now at month end positioning (bullish) which will be followed by the even more bullish month beginning equity purchases (pensions, buybacks, retirement plans, etc).

We’ve now broken through levels where a multitude of bearish “gurus” said that we would reverse lower from. WRONG.

If you follow me on Twitter, you’ve seen my chart and comments.

This tweet sums up whats about to happen next:


MELT UP….massive amounts of fresh $ coming into the market this week and into next.

The 10% correction is behind us…weak hands have sold their positions…now the shorts are being squeezed and investors are plowing 10’s of billions back into the markets weekly. The melt-up is back on.

Assuming the VRA System remains bullish this week (high odds), it is likely that US markets will hit fresh all-time highs again in the month of March, closing out a stellar first quarter for 2018.

The VRA has +2413% net gains since 2014… just getting started.

Until next time, thanks again for reading…have a great week.

Kip Herriage

Founder/Publisher VRA (2003)

To receive updates like this Daily sign up to receive two free weeks from the VRA at www.vrainsider.com/14day

Also, find us on Twitter and Facebook

Friday
Feb022018

VRA Market Update. January Barometer. Higher Rates Causing Concern. Investor Sentiment. Perspective.

At the beginning of 2018 I made the comment (to anyone that would listen pretty much) that I believed this year would our best year…possibly ever…for the VRA Portfolio and our bottom line results. If that sounded like marketing rhetoric, I get it…but it was simply what I believed, based on what the VRA System was telling us.

On all VRA Buy Recommended positions we have a total net gain of 897% with an average gain per position of 69%. This is why the VRA is a top performing investment newsletter. We can find no one who has done better.

We’ve got a long ways to go in 2018 and it will take hard work and some very good fortune to put up these numbers for the full year. To the investment gods (little g), please know “this is not me bragging” (karma isn’t a big fan of bragging), I’m simply passing the results on so we can celebrate them together.

Crushing the Markets Year After Year. Who we are and how the VRA Investing system works. 

For those of you who are new to, or maybe just learning about, the Vertical Research Advisory (VRA) I wanted to put together a video that explains how the VRA's Investing system works, tell you a little bit more about my story and how we generate returns, year in and year out, in good markets or bad. 


https://youtu.be/8-8y21NvwCw

To receive two free weeks to the VRA, visit us atwww.vrainsider.com/14day

VRA Market Update:

January closed with gains of 5–7% for the major averages (SPX, DJ, NASDAQ), while the Russell 2000 finished the month with just a 1% gain. To put things in perspective, for those that think this was the end of some sort of “melt-up”, China (Hang Seng Index) finished the month with gains of 13%.

Still, a great month to start the year. And no, we almost certainly will not keep us this torrid pace for the rest of ’18, unless we believe that the markets will end up 60–84% higher for the full year (January’s gains annualized). I’m ultra bullish…have been for a long while…but not that bullish (if I was, I would expect you to laugh me out of the business).

But here’s the most important point; the VRA does not invest in the broad market. We pick and choose our spots, with individual stock/ETF positions, using the VRA System to handily beat the broad markets (year after year). Remember, it’s not a stock market…it’s a market of stocks. As long as we’re in the right stocks at the right time, we’re good.

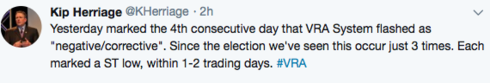
Note: The last 4 days marked just the 3rd time since the election that the VRA System has flashed “negative/correction”. For this pattern to continue, we should see a reversal higher in the next 1–2 trading days. If not, this will mark a pattern change, which could signal something larger than just a ST pause lies ahead.


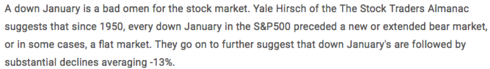
As goes January, So Goes the Year. From the Stock Traders Almanac:


Conversely, a strong Januarys signals “high odds” that the full year will close higher. My year end target for 2018 continues to signal 30,000+ on the Dow Jones (or 14% higher from todays prices, minimally).

Still, its a market of stocks…

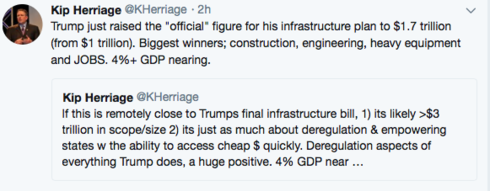
Booming January Jobs Data.

This mornings January employment report showed 200,000 new jobs created, beating estimates by roughly 10,000, with the official unemployment rate at 4.1%. But the real kicker was wage growth, which powered to an 8.5 year high. Wage growth grew a big 2.9%, beating estimates by a country mile. This is what a strong economic recovery looks like…this is also how we get back to 4%+ GDP. In fact, this weeks Atlanta Fed’s estimates for Q1 were a shocker even to me, with an estimate for first quarter GDP hitting 5.4%. We’re seeing hard core evidence of what a Trump economy looks like…just imagine what he might be able to do over the next 7 years.


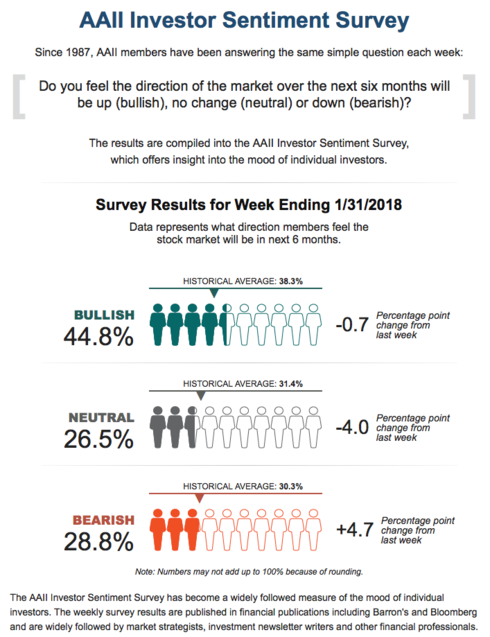
But even range expansion bull markets need to take a breather. As we covered yesterday, if the entire year were to follow Januarys lead, the market would finish the year with gains of up to 70%. Just not gonna happen…hence the overbought pause from time to time, always necessary to remove excessive optimism and stow some fear back into the market. Fear is beginning to show up, as seen in this weeks AAII Investor Sentiment Survey.

Bulls at 44.8%, bears up 4.7% to 28.8% with neutral investors still at a high reading of 26.5%


I’m looking forward to next weeks readings….I can almost guarantee you that bearish readings will surge by double this weeks 4.7% gain, following the sell-off of this week. Remember, especially for our newer members, until the AAII survey shows bullish readings of 60%, for weeks on end, there will be no signifiant top in this bull market. I’ve followed this survey since the late 80's…highly reliable. We have yet to see investor euphoria in this market, certainly not from the retail investor. Just last year I was reporting that investors actually in the stock market had hit 19 year lows. Without question, the public is falling back into love with stocks…but that’s a process that will take years to play out.

Think of it this way; when most every market guru is predicting Dow Jones 50,000, we’ll know its time to reverse my bullish viewpoint. We’re not there…not close. This is the power and importance of investor psychology, both as a short term and long term indicator. These are the lessons my mentors taught me some 30 years ago. I don’t see them even going out of style.

But again….it doesn’t mean that we won’t have corrections. Stock market corrections are necessary to the health of a long term bull market. Trees don’t grow to the sky.

Rising Interest Rates Causing Concern

A primary boogeyman, according to those that are bearish, is that rising rates will suffocate the stock market. While its true that the move higher in rates (10 year) has accelerated, with the 10 year yield hitting 2.72%, my view remains that rising rates are a natural end game from an economy that is picking up speed. Perfectly natural.

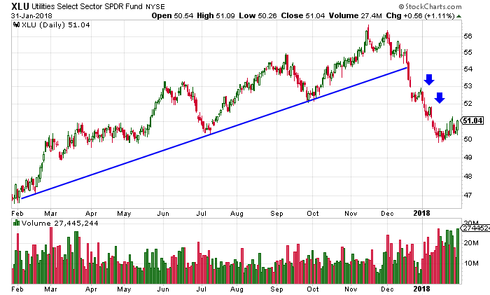
We can see the fear in this one year chart of XLU (utilities ETF), which has crated some 14% since its November highs. Utilities are the largest borrowers of money in the country, which explains the move lower. Pretty ugly chart, yes? But keep reading…


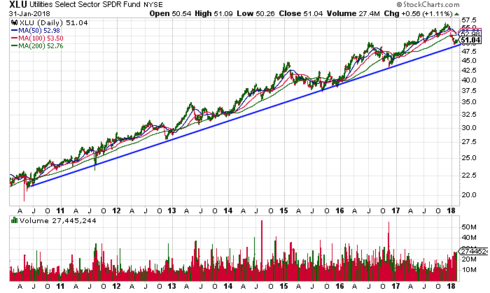
Now, take a look at another chart of XLU…this time the 8 year chart. Here, this correction looks perfectly normal, taken into broader context. Interesting…no?


While we’re on the subject of perspective, if you’re on social media like I am, it can feel like we’re living on the edge…so much going on in the world of politics and business…but are things “really” that crazy?

I was too young to remember much of the 60’s, but again, some perspective might be in order. How crazy were the 60's!


State of the Union

Wednesday’s SOTU was off the charts fantastic…of course I say this as a Trump supporter…an early Trump supporter that both predicted his victory in late 2015 and then wrote a book about his winning (that I started 2 months prior to the election). The strength of my conviction.

Dems hated it. We know this because they refused to stand throughout the night. Even for our flag, our veterans, a booming economy, the lowest black/hispanic unemployment, possibly ever. Sickening, frankly. And they wonder why they’ve lost 1031 net national elections over the last 9 years? They wonder why their fundraising efforts are collapsing? But somehow, they think they can take back the House/Senate in this years mid-terms….uhhh…..no chance, not as I see it anyway.

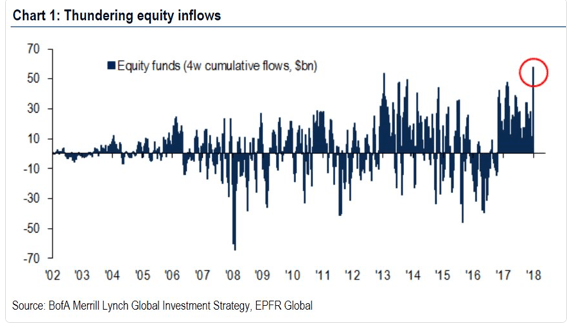
The markets sure like the SOTU. MANY billions in fresh capital will come flooding into stocks (month beginning money from corps, pensions, retirement plans, etc). And the BIGGIE; Trumps tax cuts start showing up in paychecks.

Important Point: Reagans tax cuts caused the DJ to more than double over the last 6 years of his presidency. But Trumps could be even more powerful…I fully expect that they will. Here’s why; unlike Reagans tax reform (where the cuts were phased in over years), the beauty of Trumps tax reform is that its all hitting NOW. No phase in…no waiting…everyone gets to keep/make more today. I cannot overstate the power of this. This is why pullbacks, like the last two days, must be bought.
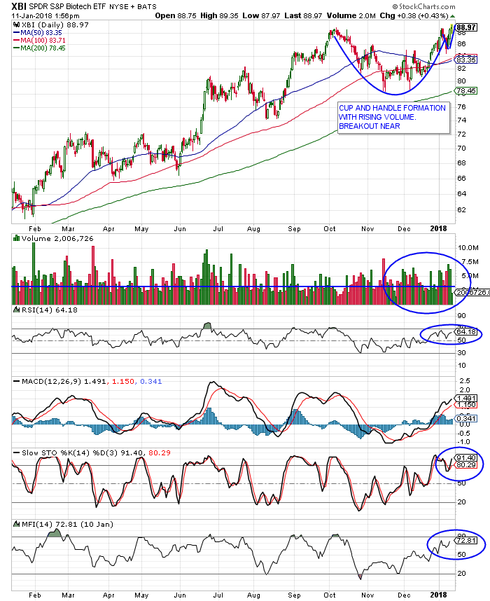
Biotechs

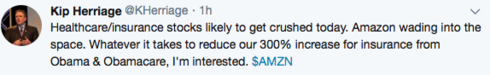
FYI, I still want to own this group… And our timing looks to have been spot on. Early this week Amazon (with partners Buffet/Berkshire & JP Morgan) announced they are moving into the healthcare industry. Hello….


If you remember the beating that grocery stocks took when Amazon bought Whole Foods, you’ll have an idea of the carnage that may be coming to healthcare/insurance stocks. And, hell yes. Since Obamacare was forced on us, our insurance costs have skyrocketed while healthcare/insurance/hospital stocks soared at the same time. Gee…wonder is there’s a connection here? Bottom line; I am perfectly fine with Amazon running our entire US healthcare industry. I know this kind of blanket statement sounds a bit insane/stupid, but I also know that when Amazon enters a field, consumer costs plummet while our level of service actually improves. Talk about a win-win.

Until next time, thanks again for reading…please remember to login to your VRA Members Site at least 1–2 times each week to make sure you are positioned properly.

Kip

To receive updates like this Daily sign up to receive two free weeks from the VRA at www.vrainsider.com/14day

Thursday
Jan252018

VRA Update: The Next Catalyst for stocks, DOW 40K and the Trump Infrastructure Plan

One of the advantages this week of waking at 3am has been watching the events at the annual Davos World Economic Forum (Switzerland), where the global warming/global cooling/climate change establishment billionaire elites take their fuel guzzling private jets to meet each year to remind us peons that “they got this”. But man oh man, are this years meetings different from the previous 8 years. Nationalism is sweeping the globe…and the elites aren’t happy about it.

This morning the head of the World Bank said “with Brexit and now Trump, we may even be forced to cut the EU and World Bank budgets this year”, he proclaimed, with shocked face and deep sigh, as the Bloomberg moderators nodded in sad amazement. And Trump is only now arriving at Davos…this should be fun.

Yesterdays meetings produced Treasury Secretary Mnuchin’s statement that “the Trump Admin. wants a lower US dollar”. VRA readers were not surprised…we’ve nailed the lower dollar trade all year (plus this was not new policy from Trump, as we’ve covered here often).

Precious metals are loving Davos. Gold soared $20/oz to $1357, silver even more, with a 3.8% gain, wile both copper and oil spiked sharply higher as well (3.8% and 2.4%). Remember, this is just the beginning of the reflation/inflation move higher. We still want to see gold break $1370 to confirm the breakout technically…trading at $1358 this morning.


Oil is ramping…but this is only the beginning of the move


I’ll have more on this soon…here’s my tweet from last night.


But know this; when I say “animal spirits are in full force” I mean that I have not heard company heads this excited in many, many, many years. They are charging forward, with more money than they know what to do with, backed up by the view that a global dynamo of an economy is directly ahead. Again, our biggest risk is selling too soon, certainly in our favorite natural resource names.

From Trumps tax reform to killing overly burdensome regulations to his upcoming infrastructure bill…just…wow. Folks, we have a president that understands how a free market capitalist system is supposed to work. And he’s just getting started.


Next Catalyst for Stocks; Trumps $3 Trillion Infrastructure Bill

As I read the leaked draft report, it confirmed one of the next major catalysts for US growth/earnings is directly in front of us. While the biggest winners are co’s like Caterpillar (CAT) and John Deere (DE), this is also how the US gets back to 4%+ GDP. I’ve been expecting a $1 trillion plan…this leaked document blows that estimate away.

And remember, to build/rebuild all of these roads, bridges, airports, schools, etc., it will require basic materials to do so (copper, lead, aluminum, silver). Just another reason to own the miners. This group will be the next big group to move.

BIOTECH Breakout

This is the technical formation we’ve been keying off of (XBI). Here’s the cup and handle chart I posted on January 11th. High probability technical formation.

138% ETF Gains In Two Months


VRA Portfolio

Strong start to 2018 for VRA Portfolio. S&P 500 is up 5.2% to start 2018…but we’ll take our 14.4%, which annualizes to 192%. Way too soon to be counting chickens…just confirmation that we’re on the right track and in the right stocks/sectors (and on the right side of the Trump Bull Market).

Here’s my BIG PICTURE tweet from over the weekend…this market is nowhere near topping out.


And the markets do just fine during a government shutdown (but yes, we are trading at Extreme Overbought Levels today, on the VRA System).


This past week saw a a fresh $58 billion pour into equities. This is what we’ve been expecting…this is what happens at the beginning of the melt-up phase…just wait and see what this chart will look like when the DJ is hitting 35,000–40,000 in 2019–2020.


Finally, My radio interview with the great @RealWayneRoot Trump bull market. Tax reform, deregulation, infrastructure bill & range expansion taking Dow Jones to 40,000.

https://youtu.be/8UTVQdVuv2o


Until next time, thanks again for reading..

Kip

To receive updates like this Daily sign up to receive two free weeks from the VRA at www.vrainsider.com/14day