
VRA Update: Struggle to Dow 20K. Repeat of 1 Year Ago? Another Reason to Love Precious Metals.
 Kip Herriage -VRAInsider.com
 Hope everyone had a very Merry Christmas and that you have an even better New Year and 2017.
This past Friday I wrote the last word of my second book. Waves of relief! "CrashProof Prosperity 2.0, Becoming Wealthy in the Age of Trump" should be out of final edits this week.
Typically this is the slowest week in the stock market...but before we decide to phone it in for the next few trading sessions, let's remember what happened at exactly this time last year.
On 12/29/15, the Dow Jones closed at 17,720, posting solid 100 plus point gains and signaled to many that we would finish the year on a strong note and then rip and roar higher as we started 2016.
But the markets had their own game plan...
The very next day...12/30/15...the Dow struggled and wound up closing 120 points lower. And the final trading day of 2015 was even worse, wth the Dow losing 175 points. It was this loss...175 points on heavy volume for New Years week, that got everyone's attention. Then, once we kicked off 2016, it was a blood bath...the Dow lost another 280 points on 1/4/16.
Before the sell-off was over, the Dow would plummet 2000 points in just over 3 weeks. An 11.2% loss in the Dow, and losses in the Russell 2000 that would more than double the Dow's loss.
It was a blood bath in stocks...and the VRA was perfectly positioned for it.
By the time we sold (1/14/16), our combined profits from 3 positions would total 139%.
Today, I see signs of what could well be a repeat from this time last year. Everyone has Dow 20,000 baked in the cake...market internals "might" be just strong enough to get us there. But what then?? And, if we fail to reach Dow 20K, look out below...the waves of selling pressure could be enormous.
Know this; if the internals continue to break down, the sell off will be ugly.
Precious Metals/Miners 2017
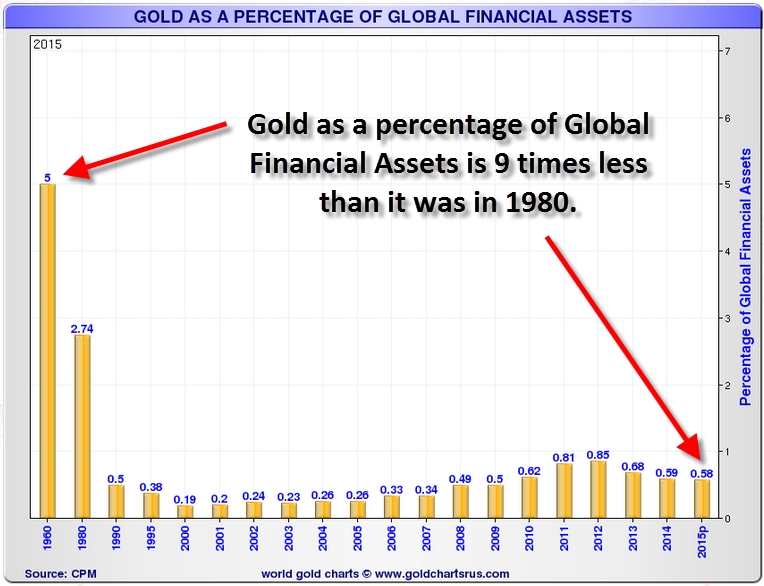
The article below appeared on Gold-eagle.com over the weekend and its a most important one. As you'll read, gold...as a percentage of total global financial assets, today trades at a level of 9 times less than it did in 1980. Today, gold makes up just .58% of all global financial assets. Remarkable!
The VRA continues to believe that January 2016 marked the beginning of the bull market in gold, silver and mining stocks. I see the same for base metals and oil/nat gas as well. It's called the "reflation trade" and almost certainly marks the return of inflation to global economies.
No one should be surprised...central banks around the world have been printing their currencies in reckless abandon for years...essentially since the 2008 financial crisis kicked off what historians will recognize as the beginning of "global currency wars". In fact, we see these everywhere we look today.
And please, do not be fooled. Inflation is defined as the "printing of fiat currency". That's the Mises definition...and its the only one that has ever mattered. Keynesian economists will soon be made to look the dunces that they are, from the NY Times Paul Krugman on (you'll be able to read all about this when CPP 2.0 is released).
Here's the article on gold holdings...just another major reason to own gold, silver and the miners.
Until next time, thanks again for reading...make it a good holiday week
Kip
Gold As A Percentage Of Global Financial Assets
In 2014 Total Global Assets Topped $105 TRILLION (i.e more than $105,000,000,000,000)
(Source: http://www.gold-eagle.com/article/making-case-12000-gold-and-360-silver)
An astronomical amount by any standards. Interestingly, only a small fraction of this monumental amount has been allocated to gold investments. Here below is the record of gold investments since 1980. To be sure a brief history of gold investment demand will indubitably put our analysis into sharp perspective.
In the late 1970s the price of gold soared to the then all-time high of $800/oz…fueled by runaway inflation of that period that propelled gold investments skyward.
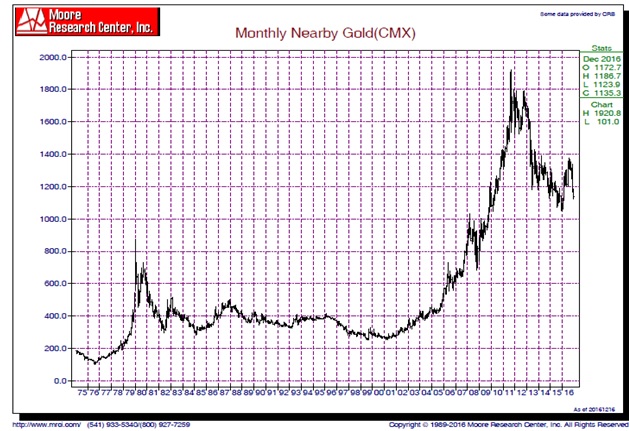
(Source: Moore Research Center, Inc)
The price of gold soared from about $160 in 1976 to a little over $800 in early 1980. It is imperative to note that in 1980, gold investments as a percentage of Total Global Financial Assets had reached 5.0%. Hoverer, gold investment demand then began to wane for many of the following years until the new century began in 2000…when the price of gold finally bottomed. In that year gold investments as a percentage of Global Financial Assets had also bottomed at 0.19%.
(Chart Source: SRSrocco Report: https://srsroccoreport.com )
By 2001 gold investments as a percentage of Global Financial Assets began a slow methodical climb until the 2011-2012 period…when gold again make an all-time peak at over $1,900. Understandably, the price of gold then slowly began to decline in concert with the diminishing gold investments as a percentage of Global Financial Assets (which dropped from 0.85% to last year’s 0.58%. Think about it: Gold investment as a percentage of Global Financial Assets were nearly 9 Times greater in 1980 than it is today. To be sure the implications and ramifications of the above are mine-boggling. Here is another chart focus on how minuscule recent gold investment is as a percentage of Global Financial Assets:
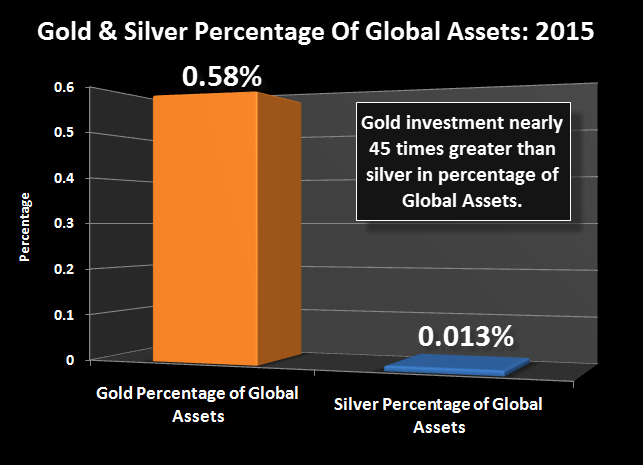
(Chart Source: SRSrocco Report: https://srsroccoreport.com )
Gold Forecast: In the event gold investments as a percentage of Global Financial Assets again rises to 5.0%, it means 0.05 X 105,000,000,000,000 = $5.25 Trillion ($5.250,000,000,000) will flood into gold. This begs the question: What might be the impact of a tsunami of increased gold investments hitting world markets?
Here Are The Estimating Rationale
- Total global gold production is estimated at about 3,000 tonnes.
- 3,000 tonnes is equivalent to 96,450,000 troy ounces (as there are 32,150 oz/tonne)
- Value of one year’s global gold production at $1,150/oz is about $110 Billion
Consequently, in the event gold investments as a percentage of Global Financial Assets again increases from 0.58% to 5.0%, the demand might explode exponentially to $5,250,000,000,000 ($5.25 Trillion). For this reason this analyst does not dare try to predict how high the gold price will be turbocharged as a result...when this happens. 2017 looks to be a Golden Year for precious metals investors.
Reader Comments