Journal Archive

"Kip's VRA financial newsletter is a MUST read for every saavy investor in this country. Disregard it at your own peril. His mantra is my mantra. Kip Herriage's newsletter is my financial Bible."

--Wayne Allyn Root
2008 Libertarian Vice Presidential candidate
Author, "The Conscience of a Libertarian"

SUBSCRIBE TO OUR BLOG!

* indicates required
Twitter: @kherriage

Entries in gdx (23)

Thursday
May282020

VRA Weekly Update: 40 Million Newly Unemployed. Sentiment On the Move. Risk On Move Higher Producing PM Pause.

Good Thursday morning all. Another 2.1 million have filed initial jobless claims, taking the total to 40 million from the onset of CV lockdowns. Many/most blue states are in no rush to reopen their economies and even in states that are reopening, the economic damage is severe. We maintain our view that this is a bear market rally but that it is likely the lows are in place. However, just as investors are coming rushing back into the markets, the next wave move lower will kick in.

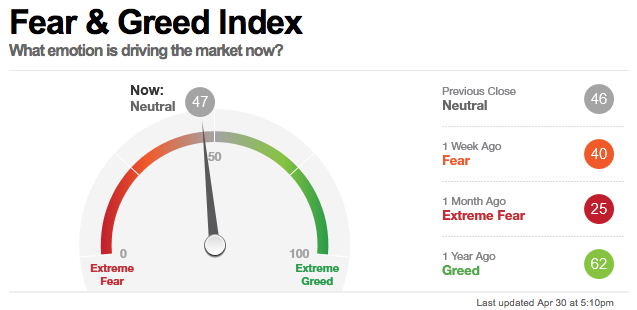
In fact, we’re seeing renewed optimism in newly released sentiment surveys overnight with the AAII Survey now at 33% bulls (+4%) and bears at 42% (-3%), with the Fear & Greed Index at 54 this morning, a new post CV high.

The markets recovery move higher this week has been rotation based (from growth to value) with Nasdaq/QQQ/Semis now trailing, oil reversing lower and the VIX reversing higher. Our bear market rally playbook keys flashing early warning signs.

The most beaten CV names now leading the way; airlines, casinos, banks. The question everyone is asking; are these “catch-up” moves for real…or is this a dead cat bounce before resumption of a bear market move lower”.

If we had that answer this morning, we would share it with you. What we do know is that one by one, our major indexes are trading back above their 200 dma. First it was Nasdaq/QQQ/semi’s. Then it was SPY. Now we can add the S&P 500 to that list.

The talking heads claim the move is occurring because of optimism for a CV vaccine. Not buying it. Vaccines typically take years.

This market is going up for two primary reasons; 1) Central bank/gov stimulus, which sits at $10 trillion plus today (not including the use of leverage) and 2) FOMO; fund managers are being forced to play catch-up. They’ve been positioned bearishly and fear the train is leaving the station. Classic late move action.

Yes, the markets are hitting heavily OB on key momentum oscillators. Yes, this move feels very long in the tooth. Yes, Nasdaq/QQQ/oil look to be tiring…our bear market rally playbook keys…and yes we have our next Options target ready. But “Don’t fight the Fed combined with don’t fight the tape” makes that action premature, especially with yesterday's internals and breadth, which were rock solid across the board.

Note: 90% of all S&P 500 stocks are now trading above their 50 dma. That sounds like an alarm bell until you check the percent trading above the 200 dma, which sits at just 37%.

Risk On Move Higher Producing PM Pause.

The current “risk on” environment has produced a pause in PM’s and miners, but you wouldn’t really know that from our positions, which are holding up well.

Here’s an excellent piece from this week on the miners from ETF Review…we’re including it for you here. Pullbacks in PM’s and miners (VRA buy recs gold, silver, NUGT, VGZ, TRQ) are buying opps.

— — — — 

ETF Review: Should Investors Buy GDX on This Pullback

It’s been an incredible start to the year for the Gold Miners Index (GDX), with the index up 21% year-to-date, outperforming nearly all other asset classes thanks to lower oil prices and continued strength in the gold (GLD) price. While the index was briefly derailed in March following overall market turbulence, it has since soared to new multi-year highs and is working on its strongest quarterly gain ever, up 55% for Q2 thus far. In the past decade, these brief spurts of relative strength have been short-lived, with the S&P-500 (SPY) clawing back to outperform the miners and reassert control over the Gold Bugs Index to S&P-500 Ratio. However, this time around looks like it might finally be different, as the miners continue to digest their gains in a normal fashion, and have broken out from a multi-year range last month. Based on continued fundamental tailwinds given the miner’s lower costs and higher average selling price and a robust technical picture, I believe the sector is one to watch closely, and one to buy on dips.

Beginning with the below chart, a relative strength gauge of the Gold Bugs Index and the S&P-500, we can see that the miners have been out of favor for years, consistently losing ground to the S&P-500. This is quite important, as while owning miners certainly has made sense if they’re stair-stepping higher, it’s made less sense if the S&P-500 companies are stair-stepping higher at a brisker pace. Therefore, the gold miner trade has made little sense other than a hedge, and this has been a headwind for getting investment dollars into the metals complex. However, we’ve seen a massive shift in this ratio over the past six months, as the ratio has finally broken above its long-term moving average (yellow line), and seems to be holding above this level with ease the past few months. This is not what we saw in 2016, and the index ran up towards this moving average and then crumbled almost immediately. This shift to a bullish posture for this ratio has significant implications over the medium-term, and potentially long-term for the gold miners, as long as this index remains above this key moving average.

If the bullish shift in the above ratio occurred due to a crash in the S&P-500 that was not recovered, I would slightly discount this shift. However, this is not the case currently. While the Gold Bugs Index made massive headwind against the S&P-500 given the crash in the major market averages, the S&P-500 has been steadily melting higher since, meaning that the Gold Bugs Index would have to show significant relative strength to maintain this bullish flip in the ratio. This is exactly what the index has done, and it’s been one of the first asset classes to break out to multi-year highs. Based on this, it’s clear that this is not a brief mean reversion like 2016, or a false start in the index; instead, this points to a higher likelihood that this is the early innings of a new bull market. Let’s see if the Gold Miners Index is confirming this:

(Source: TC2000.com)

As we can see from the above chart of the Gold Miners Index, the miners are sporting a massive breakout on their monthly chart, with the index clearing the $31.05 level ease on the April monthly close. This is an extremely bullish development as new highs typically occur for a reason. While brief pushes above old resistance areas are less important, surges above old highs that clear these levels on longer-term time frames are worth paying attention to for investors, and this is clearly a breakout that has some strength behind it. Thus far, we’ve seen continued follow-through to this breakout in May, and this is precisely how we would expect an index to act if a resistance level is truly in the rear-view mirror. Therefore, as long as the index can remain above $31.05, I see no reason to lose faith in the bigger picture for the miners. A 15% to 20% correction would be completely normal after a triple-digit rally like we’ve seen in two months. However, this would likely be a shake-out in a bull market, not a break like some weak handed investors might conclude before losing their positions.

In summary, the breakout in the Gold Bugs Index vs. the S&P-500 coupled with a multi-year breakout in the GDX suggests that a new bull market has finally begun in the gold miners, and investors would be wise to start nibbling on any significant dips. While some weakness into June would not be surprising, weakness early in a bull market is typically a buying opportunity. Therefore, rather than getting anxious, the key will be to watch how the index acts against the critical $31.05 breakout level. As long as this level is held, pullbacks can be considered as noise. While the S&P-500 has been the leader for several years and the only index it’s made sense to park money in, the miners may finally be stealing the spotlight, and dips will likely present buying opportunities.

— — — — 

Until next time, thanks again for reading…

Kip

Since 2014 the VRA Portfolio has net profits of more than 2300% and we have beaten the S&P 500 in 15/17 years.

Join us for two free weeks at VRAInsider.com

Sign up to join us for our daily VRA Investing System podcast

Also, Find us on Twitter and Facebook

Friday
May012020

VRA Weekly Update Best Month Since Jan 1987. Best April Since the Great Depression. Next, a Retest of the Lows. HELOCs, No More. Sentiment Update

Good Friday morning. Because this matches my views…pretty much exactly…let’s kick off this morning's update with a piece featuring Jeff Hirsch of the Stock Traders Almanac. I know Jeff’s father (Yale) from my early days on Wall Street. As a 27-year-old newbie, we met over dinner at Tavern on the Green in Central Park. Yale was already a legend…one of the very first to use analytics to beat the markets. While Yale is still alive and working, in his 90’s, Jeff now runs the Almanac.

‘What a month. In the midst of a pandemic lockdown that has seen some 30 million Americans file for unemployment benefits, and millions more around the globe, the S&P 500 surged 12.7% in April. That is the best monthly performance since Jan. 1987, and the best April since the Great Depression.

Jeff Hirsch, editor of the Stock Trader’s Almanac and chief market strategist at Probabilities Fund Management, says the lows from late March are likely to hold. He presents this chart on weekly jobless claims and bear markets, and finds the big bear market lows of 1970, 1974, 1982, 1990, 2001 and 2009 were marked by the peak in jobless claims.

The most recent claims figure of 3.8 million for the week ending April 25 is well off the peak of 6.9 million (http://www.marketwatch.com/story/us-jobless-claims-climb-38-million-in-late-april-to-push-coronavirus-total-to-30-million-2020-04-30). But that doesn’t mean he’s optimistic about the market.

“Even if March 23 turns out to be the ultimate low (and it does look like it) that does not mean the next six months or more are going to be pure rally to new highs. In fact new highs are not likely for quite some time and we will likely retest the lows,” he says. “There are some promising vaccines and treatments in the works and states are beginning to reopen, but there is no way of knowing when our lives and economy will return to some semblance of normal.”

— —

Our views at the VRA line-up with the Almanac. The amount of Fed QE and govt stimulus already surpasses $11 trillion, with almost certainly more to come. The very definition of Don’t Fight the Fed. And yes, it does look like the 3/23 lows may hold…but a retest of those lows is also likely. As Fundstrats Tom Lee has also consistently pointed out, past bear market lows have been marked by the peak in jobless claims. With a bit of luck, we may have seen this peak…but real damage has been done…a retest of the 3/23 lows could help mark true capitulation.

We know what group must continue to be bought. Gold is headed past $2000…likely past $3000…and the miners will outperform by 3:1.

The Dow gave up 300 points yesterday and has further futures losses of 450 points this morning, oil was back to $20, +6% this am before falling into the open, and as covered yesterday these are signs of a reversal that we are looking for before taking aggressive action on the downside (VRA and Parabolic). The bear market rally may be ending…today's action is important.

Here’s our bear market rally playbook…sneak peak at what we’re looking for to begin taking aggressive action on the short side (VRA and Parabolic). The following kicked off our 35–40% move lower…these are the repeating patterns we’ll be watching for:

1) Oil prices resume their move lower.

2) Market internals start breaking down (on big sell-side volume)

3) Tech/semis/biotech/healthcare start leading the way lower

4) Sentiment reaches neutral/bullish

5) Volatility spikes (even on up days)

These are the same 5 early warning indicators from the 3rd week of February breakdowns. This is the repeating pattern we’ll be watching for. We do not believe we are out of the woods. Far from it. 30 million aren’t just going to get their jobs back. The world's economic engine isn’t just going to fire back up. The worst time frame to be an investor (May-September) is directly ahead. And elections are just 6 months away.

Check out the latest video on our website where I’ll walk you through this in detail.

https://www.vrainsider.com/

— —

Wells Fargo and JP Morgan Putting a Freeze on HELOC’s

Just as US banks did in mid-late 2008, home equity lines of credit are being halted. Not a positive…also not a huge surprise. But in no way is this a positive. Another source of liquidity for Americans is being removed. Lockdowns are destroying the housing market, the single most important asset for Americans and the VRA’s top leading economic indicator. Banks indicating they won’t stand by and be blindsided like 08/09. Good for them…bad for homeowners. After banks halted HELOC’s in 2008 it took them 9 years for leading banks to make them available again. The banks know what’s coming. This will almost certainly put pressure on the Trump administration to do provide additional stimulus. As in, much more.

AAII

AAII Sentiment Survey is out. 30% bulls, 44% bears, 25% neutral. For the first time in 11 years, yours truly voted “bearish”.

Fear and Greed Index @ 47. In bear markets, like this one, investor sentiment is not a great gauge of future moves. The public is too shell shocked to become neutral/bullish again, but after this 35% move higher I would have expected both of these surveys to have ticked up more than they have. I do not consider this to be bullish or bearish…just realistic. Lockdowns will prove to be the most destructive force to ever be used against humanity. Intentional economic destruction. Megalomaniacs and fascists…our planners all.

Until next time, thanks again for reading…have a good weekend

Kip

Thursday
Mar192020

VRA Members Podcast. Manufactured Crisis, New Patriot Act. Ideas For Your Own Massive Bailout, Today!

Good Thursday morning all. As of 10 minutes ago, 9278 dead globally. 150 in the US. Swine flu killed 500,000 globally and approx 13,000 in the US. No panic. No economic/market crash, no mass hysteria.

We know what this is. Manufactured crisis. Like the Patriot Act after 9/11, this is about one thing. Control. But the coming version of the 2001 Patriot Act will go farther. This time the control will reach global and American companies. No longer will they be allowed the freedoms they had before. And you know what, a whole lot of those freedoms only hurt the people, so maybe it won’t all be bad.

The key point is, “they” had to keep pushing company stock prices lower…had to destroy CEO’s and boards ability to say “no”…had to inflict enough pain to get them to say uncle. Looks like most are doing just that. “Please bail us out…we’’ll give you whatever you want”.

But again….manufactured crisis. Without question. We see what’s what…

VRA MEMBERS PODCAST:

https://soundcloud.com/user-640389393/vra-members-only-podcast-31920/s-gYDrQzjWLdR

Please make sure and listen. I get into ideas that you can use TODAY to put several months of money in your pockets right now. Give you some breathing room. And I walk you through whats about to happen to the markets (parabolic move higher) and the one sector that must be owned….right now.

— — 

Here’s my interview with our great friend Wayne Root last night. I’m on each night at 8:30 this week…likely into next…join us!

https://soundcloud.com/user-640389393/kip-herriage-live-on-war-now-with-wayne-allyn-root-31820

Until next time, thanks again for reading…

Kip

Since 2014 the VRA Portfolio has net profits of more than 2300% and we have beaten the S&P 500 in 15/17 years.

Join us for two free weeks at VRAInsider.com

Sign up to join us for our daily VRA Investing System podcast

Also, Find us on Twitter and Facebook

Thursday
Feb202020

VRA Update: Trump Economic Miracle. Precious Metals and Miners. The Breakout is On.

Good Thursday morning all. The Philly Fed Index (manufacturing) numbers this morning were pretty remarkable. 36.7 vs est of 8. I don’t put much stock in any single economic report…I actually trust few…but this massive beat does help to put another dent in permabears that love to scream “the US economy is getting weaker.” Recession any day now, don’t ya know :)

The bear's biggest theme continues to be interest rates, as in “rates would not be plummeting if the economy was as strong as you claim Kip.” As I’ve worked to explain to my bear friends for the last couple of years, US rates will continue to decline, regardless of how strong the US economy is (and it's very, very strong).

Why is that? Gravity. Our rates must fall due to international fund flows coming into the US, in order to capture our MUCH higher yields. Simple supply and demand 101.

Precious Metals And Miners

PM’s and miners continue to trade well but, and this is not a biggie, we did not get the volume increase we were hoping for. GDX traded 45m shares vs 65m yesterday. I find that odd but not concerning. Investors have been faked out by this group for so long that its likely skepticism that’s keeping them a bit cautious. But…and this is very good…today we saw an interesting structural development. For the second day in a row gold, silver and the miners (GDX) all closed at the highs of the day. I cannot remember the last time that happened but its a highly bullish development. NUGT was up another 4.8% today, taking its 2-day gains to just under 15% (closed at $35 today).

Once the algo’s jump in…our friendly Skynet bots tend to act together…I expect we’re going to see some rather amazing fireworks.

Also seeing some great charts on gold and GDX from the world of technical analysis. Know that everyone and their momma are watching this group. I mean, the fundamental side of this story could be no better. We cover this often but the world is awash in liquidity, wealth, debt and a shit-ton of currency inflation. You literally could not draw up the fundamental side of this story any better. And, if it's true that the manipulators have been sent a very strong message to back off (JP Morgan RICO case), the move higher that we’re about to see in gold, silver and the miners could surpass even my lofty targets. 

What I know for certain is that if gold and silver had not been hypothecated 100 x over for these many years…much of it through the creation of the ETF’s “GLD” and “SLV”…it’s a “lock” that gold would be trading at $3000 to $5000/oz plus today. But it appears that you and I may now be on the same side of the major money center banks. If you remember that piece on JP Morgan I sent out a month or so ago(link below), it claimed that not only was JPM the largest gold/silver short of the past but it had also hedged itself and was the largest holder of gold as well. Let that sink in. They win either way…but now they actually want it to go up.


https://www.bloomberg.com/news/articles/2019-09-16/jpmorgan-s-metals-desk-was-a-criminal-enterprise-u-s-says

Bottom line: I believe its increasingly likely that a parabolic move higher is nearing in PM’s and miners. In addition to following gold from the age of 18, when my father bought gold at $800 (he nailed the top, on its way to $380…a 21 year bear market), I started attending precious metals conferences with clients in the late 90’s. Over the VRA’s 15 years we’ve done well in this group. I’d also like to think I have a good feel for this industry. My instincts tell me we’re about to get that parabolic move. It will go on for years. Where will it end up? I think this is that bull market. The one that takes gold to levels that you’d think I was crazy if I put it in writing.

Again, lots of great chart work out there…all saying the same thing; “here we go”.

Heres what I see in my (simple) 10 year chart below. GDX is nearing a triple top at $31 that has been in the works for 7 years. That’s one long base folks. Massive amounts of energy have built up inside of this base. Triple top formations are interesting, as in on the 4th attempt you’re likely to get a blast off breakout. GDX sits just 4% away from $31, after its close of $29.75 today. Should that occur…and I’ll tell you what few will…there is NO resistance after $31. How is that? Because those higher prices occurred more than 7 years ago and those holders no longer matter. They’ve either moved on or sold/bought/sold/bought many times from 7 years back and that resistance is not actually resistance. The ATH was $66.94 (9/2011). We will break though these levels…rather easily….likely in 2–3–4 years.

And remember my favorite contrarian reason to own this group. Today there’s just 1 mining stock in the S&P 500. Newmont. If I only had this as a single fact I would buy this group aggressively. This is the very nature of how sector bottoms occur.

Lastly, we remain at 10/12 VRA Screens bullish. Yesterday’s podcast is a must-listen. Markets that go up on bad news almost certainly want to go higher.

https://soundcloud.com/user-640389393/vra-podcast-kip-herriage-daily-investing-podcast-feb-19-2020

Until next time, thanks again for reading…

Kip

Since 2014 the VRA Portfolio has net profits of more than 2300% and we have beaten the S&P 500 in 15/17 years.

Join us for two free weeks at VRAInsider.com

Sign up to join us for our daily VRA Investing System podcast

Also, Find us on Twitter and Facebook

Thursday
Feb062020

VRA Weekly Update: Right Back to ATH. Uber Earnings. JPM Gold Manipulation. Gold, Miners Breakout in 3, 2, 1.

Good Thursday morning all.

Wonder what new all time highs just a week after the corona with lime virus is telling us? The world's best discounting mechanism acts as our crystal ball.

As you may have noticed we don’t get bogged down much with the news of the day…the hot economic deadlines of the day…or the panic-filled hair on fire MSM/permabears. There’s no reason to.

We built the VRA Investing System with this in mind. Remember, had Mondays open been sharply lower….in the range of 300 points or so….the VRA System would have gone to 11/12 screens bullish. Just missed adding SOXL to the portfolio (but will at next possible chance). In the last 3 trading days the Dow has gained 1100 points. Techs/semis/housing leadings…just what we wanted to see. Internals were on fire. Best NYSE/NASDAQ breadth in 3 months. Not the action of a dead cat bounce. As Tyler covered in yesterdays podcast, “the lows are in place.”

Sign up for daily podcast alerts at vrainsider.com/podcast

Our views have not changed over the last 3 years. We were the first to call The Trump Economic Miracle. Our conviction in the following stands;

- This is the Trump Economic Miracle. Following our 15 year nightmare we are due for 1–2 decades of peace and prosperity.

- The US leads and the world follows. This is a global bull market. Dow Jones 50,000+ by end of Trumps second term. 50K represents a an avg return of 13%/year (dividends included, not compounded). 75,000 is a possibility (29%/year, dividends included, not compounded).

- Investor sentiment remains decisively bearish…fund flows into bonds and away from equities continue to prove this point. Powerful bull markets (like this) only end when the public falls in love with stocks. When people start quitting their jobs to day trade and home equity lines of credit are aggressively added to the markets, we’ll know we’re getting nearer to a top. Today, we’re in 1997 of the bull market of our lifetimes. Tesla’s melt-up is a microcosm of this bull market. In the last 2 days RobinHood has added more than 15,000 new accounts whose first trade was to buy Tesla. The public is falling back in love with equities. This is how it begins.

UBER (UBER) reports after the close today. We like this stock very much here. This bull market features mega-cap brand name monster size co’s. See what stands out on this list of global leaders:

Company and Market Cap:

-Amazon $1 trillion

-Facebook $600 billion

-Tesla $132 billion

-Uber $62 billion

With a market cap of just $62 billion (5 x rev), Uber is the next global brand leader to go. Todays earnings really do not matter…but I expect a positive surprise in the share price regardless of the amount they lose…Uber’s discounting mechanism is already at work.

JP MORGAN CRIMINALITY IN PRECIOUS METALS MARKETS

Now we have another case proving JP Morgans LT role in the manipulation of gold/silver and likely anything else this criminal enterprise touches. You or I do this, there is no trial. Straight to jail.

https://twitter.com/Amdalleq/status/1225219643138142210

Gold and Miners are absolutely ready to go. VRA Member Mark from Bama sent this over last night. GDX chart, right at lower channel line. Next move higher signals $31…what we’ve been looking for. This group has driven investors crazy for decades. When it moves, its a rocketship. And remember this; today there’s just one gold/silver miner in the S&P 500 (Newmont). If that’s not the biggest contrarian buy signal not sure what is.


And finally, we’ll leave this here for our fans of car racing…drafting 101 (use link)

https://twitter.com/KHerriage/status/1225400440948502530

Until next time, thanks again for reading…

Kip

Since 2014 the VRA Portfolio has net profits of more than 2300% and we have beaten the S&P 500 in 15/17 years.

Join us for two free weeks at VRAInsider.com

Sign up to join us for our daily VRA Investing System podcast

Also, Find us on Twitter and Facebook