Journal Archive

"Kip's VRA financial newsletter is a MUST read for every saavy investor in this country. Disregard it at your own peril. His mantra is my mantra. Kip Herriage's newsletter is my financial Bible."

--Wayne Allyn Root
2008 Libertarian Vice Presidential candidate
Author, "The Conscience of a Libertarian"

SUBSCRIBE TO OUR BLOG!

* indicates required
Twitter: @kherriage

Entries in stocks (103)

Wednesday
Nov222017

VRA Market Update: Happy Thanksgiving. Exciting Year End. BIG Breakout in Oil. Dow Jones 35,000. Silver and Gold. Housing Market

Good Wednesday Afternoon all. I'd like to wish everyone in the US a very happy Thanksgiving. Markets are closed tomorrow and open for just a 1/2 day on Friday. Yours truly will be back with you first thing Friday morning (at the latest).

VRA Market Update: First, the fundamentals.

As you know, I am hyper-bullish on both the economy (US and global) and the stock market. My LT target for the Dow Jones is 35,000. Of course no one knows for sure...but as I've written for a very long time, until a euphoria filled move higher takes place that gets everyone uber bullish, we will not see a market top.

Watching Bloomberg this morning I found the rare Wall Street portfolio manager that agrees with me.
 
Here's my tweet and link to the video: https://twitter.com/KHerriage/status/933305105662840832


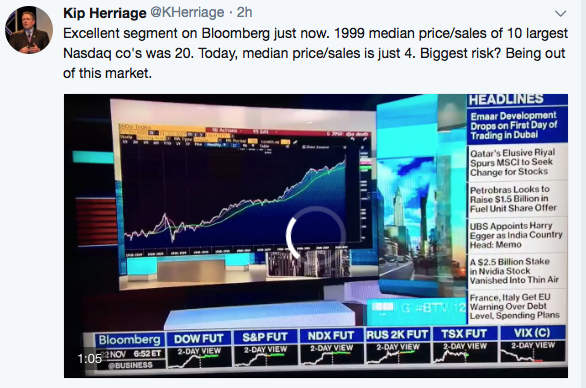
He makes an excellent point. I see FAR too many that continue to fear monger investors that stocks are overvalued. They are not. By my estimates, today the DJ should be trading at 28,000...we're headed there at a minimum...likely far faster than most believe could take place. This is the beginning of the melt-up.
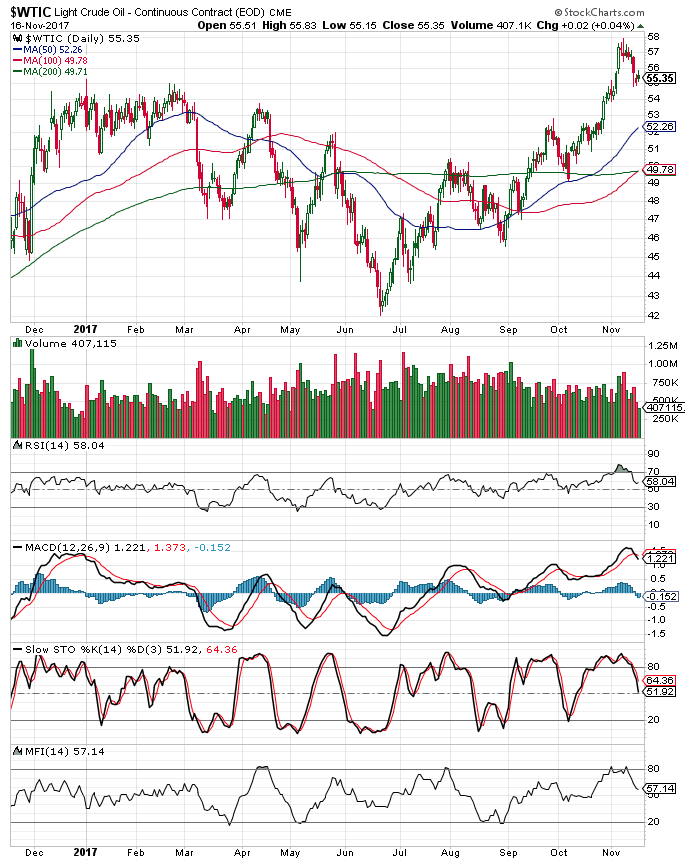
OIL IS FLYING

This morning, the breakout in oil is continuing, with near $58/barrel prices, levels not seen in more than 2.5 years. Take a look at this beautiful chart.

Once we broke through $56, there was little doubt that the next big move would be higher. Again, "volume precedes price movement"...see the massive volume increase in oil over the last year? This chart looks similar to what we're seeing in every major industrial metal...long term, large volume moves higher. This tells us that the smart money is coming in hard and that this move will be more than just a minor breakout higher. BTW, we also see very similar looking charts in gold and silver...as I'll show you next.
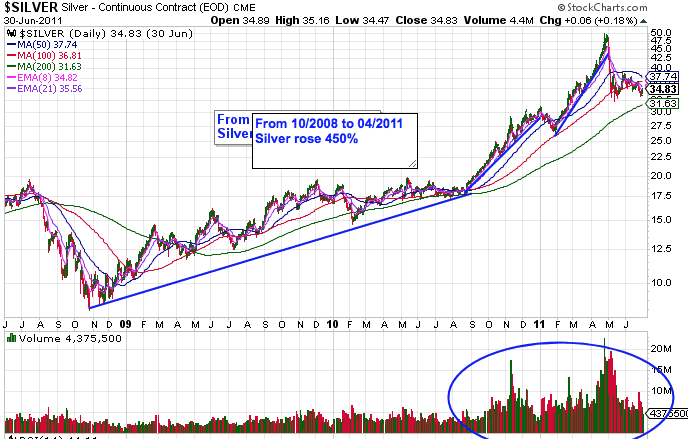

Silver

Here's the 2 year chart of silver I referenced. Again, check out the explosion in volume. Combined with the fundamental story of a big global economic recovery (silver is as much an industrial metal as it is a precious metal), plus the fact that inflation will be one of the biggest macro themes going forward, precious metals must be owned. Of course this is even more bullish for the miners. Watch what's about to happen with this sector...coming out of the FED rate hike...we've seen moves of 10% to 127% in GDX (mining ETF) over the last 4 rate hikes. We're going to make SILLY money here....and we're certainly due. Patience will soon be rewarded. 


GOLD

Gold is being bounced around like its on a pinball machine. Watching the day to day drip. drip drip in gold/silver/miners, with continued price suppression schemes of the manipulators has reached absurdity, as you'll see in an article from GATA in just a moment. 

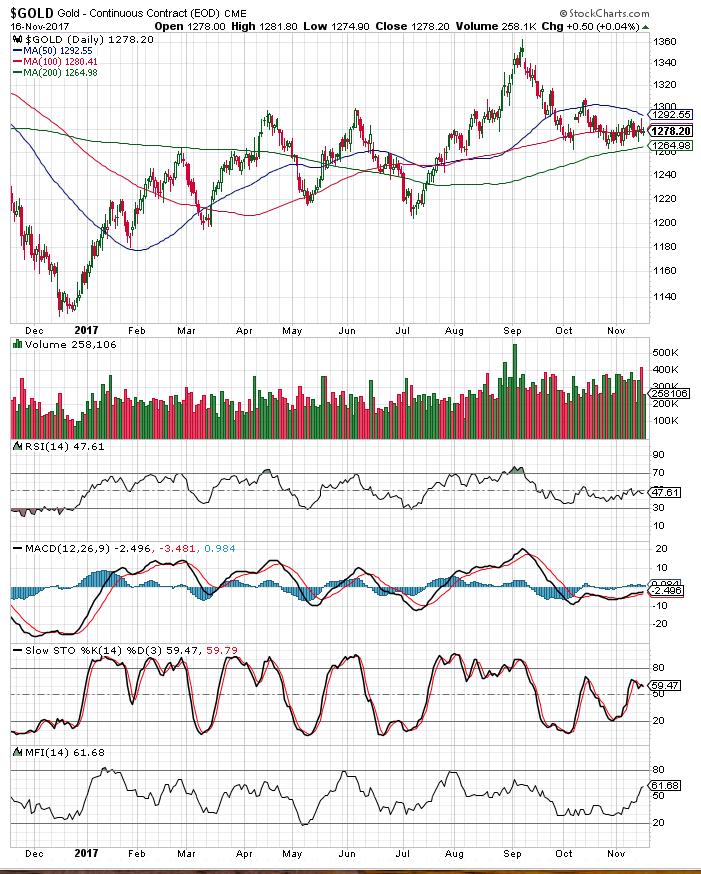
First, take a look at this LT 4 year chart of gold.The 200 day moving average sits at $1265/oz, meaning that gold is just $10/oz above. Still, everything about the chart below says that it must be owned here...same with silver...and of course the miners. 

For one, check out the huge volume increase in just the past year. My mentors taught me that "volume precedes price movement" and based on this single fact alone, the next major move in gold should be higher...much higher. 


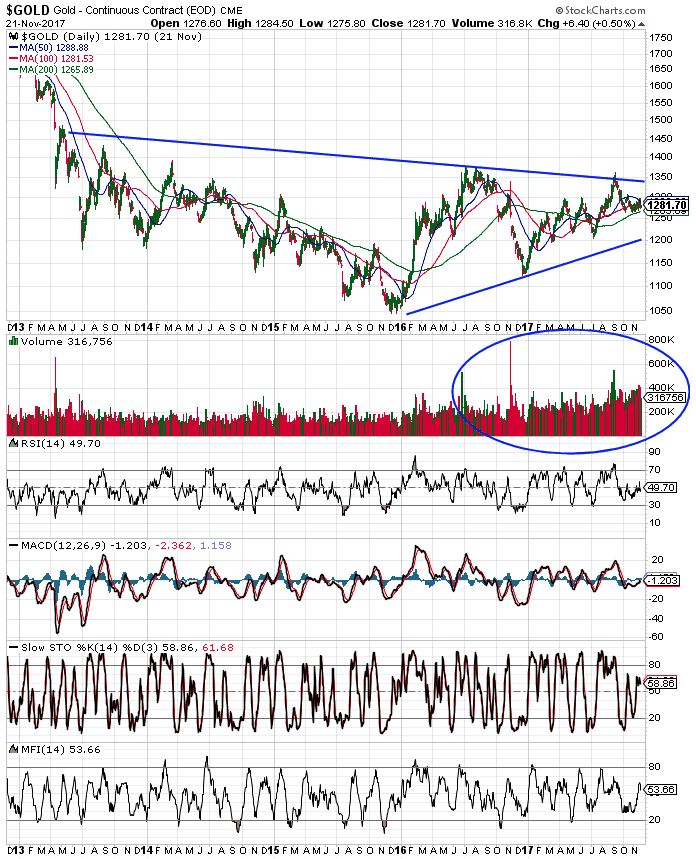
The FED is set to raise rates again in December. It's my continued belief that while precious metals may be "soft" heading into the rate hike, just as we've seen with the last 4 rate hikes, once it is completed we can expect a big spike higher. Yes, that means we have a couple of weeks to sweat it out...not much we can do about that... gold, silver and the miners will rally hard into year end then into 2018. Inflation is back...we see it everywhere we look...inflation is golds best friend. 

The article below, from GATA (gold anti-trust action committee) spells out the atrocity that is the price suppression scheme of central banks and their favorite global mega banks. 
This quote sums it up best...92-1 ratio of paper gold to physical gold. This is the criminal amount of dilution that we are hit with daily....

Zero Hedge writes: "According to the Reserve Bank of India's estimate, the ratio of 'paper gold' trading to physical gold trading is 92 to 1, meaning that the price of gold on the screens has almost nothing to do with the buying and selling of physical gold.

Dear Friend of GATA and Gold:

 Zero Hedge called attention to Friday's column by Gillian Tett of the Financial Times, to which GATA also had called attention --


in which Tett speculated, as many in the gold sector have done, that the futures market being planned in bitcoin by CME Group would tend to suppress the cryptocurrency's price. 

Of course the use of futures markets to suppress gold and commodity prices has been one of GATA's themes for a long time, and a theme of the British economist Peter Warburton for even longer:

So Zero Hedge concluded its post by suggesting that Tett now pursue the gold price suppression angle, noting that GATA has been urging just that on the FT for quite a while. 

"This makes the gold market and, therefore, the gold price something of a mockery." As Zero Hedge has highlighted time after time, the gold price has frequently been subject to waterfall declines, as huge volumes of gold futures are dumped on the market with no regard for price. ...

"Perhaps the FT journalist, Gillian Tett, could write an article on gold, instead of bitcoin, explaining how the price of the former -- a widely viewed indicator of financial risk -- is being suppressed by derivative trading. Indeed, Tett was present at a private dinner in Scott's of Mayfair several years ago when the Gold Anti-Trust Action Committee gave a presentation on exactly the same process she expects to lower the bitcoin price."
Zero Hedge's commentary is headlined "Financial Times: Sell Bitcoin Because the Market Is about to Become 'Civilized'" and it's posted here:


Housing Market Rally 

As you know, I'm "all-in" on the Trump bull market and ongoing US economic recovery. That's no secret to anyone that's been reading the VRA, since the election. 
 
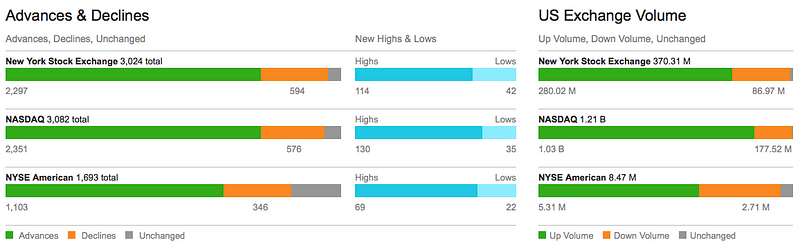
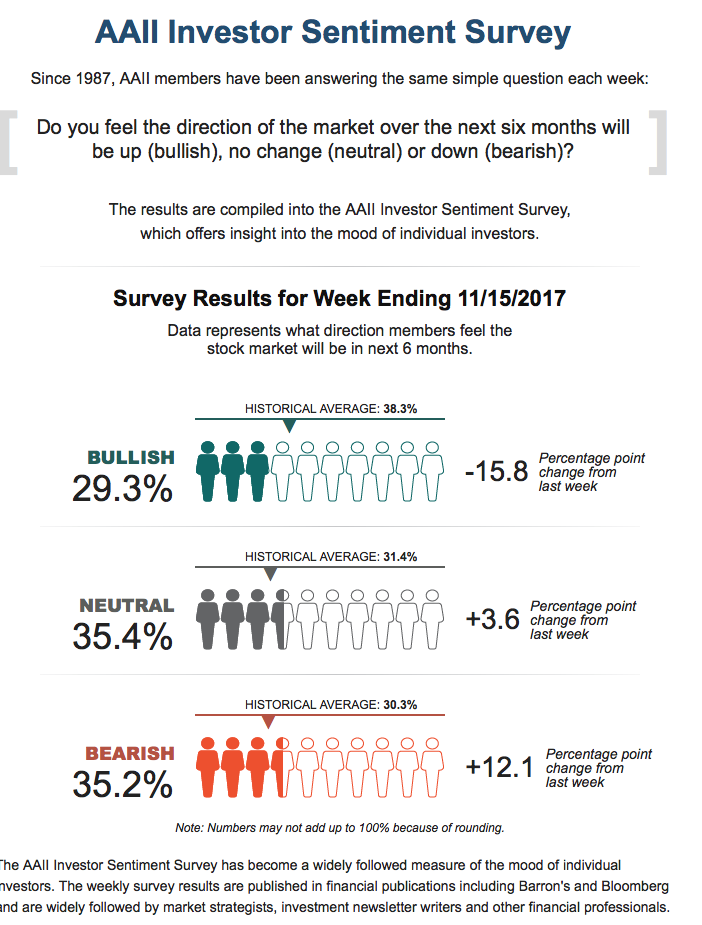
From a quick return to 3% GDP to the remarkable recovery in consumer confidence and spending, one thing is crystal clear; this economic recovery (both in the US and globally) has at least 2-3 years to run. The good news for us, as we witnessed again this past week, is that investors continue to be more bearish than bullish (as we saw in the AAII Investor Sentiment Survey). As a contrarian, bearish investor sentiment is exactly what we want to see. Bearish sentiment confirms for us that we are nowhere near the highs for this bull market. Those highs will come when the AAII survey is 60% + bullish...and for weeks/months on end. Those highs will come when everyone is adamantly bullish and (like me) and predicting Dow Jones 35,000 by 2020. 
 
And of course one of the biggest reasons to be bullish today...seasonality. 90% + of all market gains come during the November to May time frames. 
 
But for those looking for clear proof that the US economic recovery is not only real but still in its infancy, the chart below should provide that proof.
 
Below is a 15 year chart of HGX, or the US Housing Index. 
 
In 2005, housing topped out. In 2006, housing began to plummet. It was at this time that the VRA began to recommend caution on both the economy and in stocks. I may have been about 6 months early, but I know that my warnings helped many to either sell their real estate or simply put off buying more of it. 


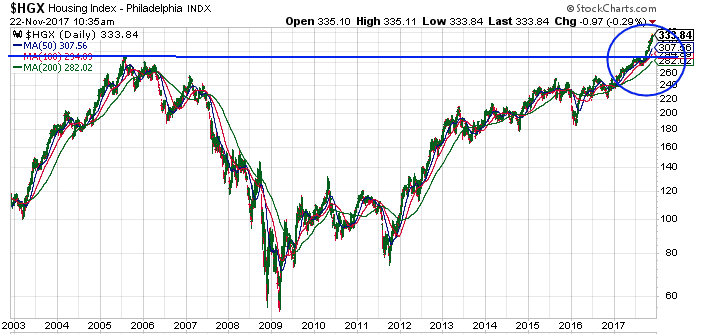
In 2008, the crash was on. And what a crash it was. Most Americans are still digging out from the Great Financial Crisis. At least that was the official title our financial charlatans assigned to it. As always, we should ignore what these wrong-way PHD economists tell us....because here's the hard core truth; the US was actually in a "Depression" for 4 years. That's right...we actually went through an economic depression.
 
With GDP barely averaging 1% during this time frame, when you remove the 1.4% in GDP that the income for government workers provides for the US economy, from 2009-2013, the US was actually in a tough depression.
 
This is why, in early 2013, the VRA went from LT bearish on the stock market to LT bullish...and I've remained LT bullish ever since.   
 
Now, take one final glance back above at the HGX chart. That blue circle tell us where we are today....fresh all-time highs. And here's what matters most; when markets break out to new all-time highs, that breakout actually marks "the beginning" of the move higher...rather than "the end" of the current move. I can find no example of fresh 10 year highs in any market that then signaled reversal, once those new all-time highs have been reached. Not a single example. 
 
Barring a black swan event, a ramping housing market, along with US income tax receipts at record highs and the bullish combination of sentiment and seasonality, we have no choice but to remain fully invested. We also have no choice but to be highly bullish on prospects for the US economy.  

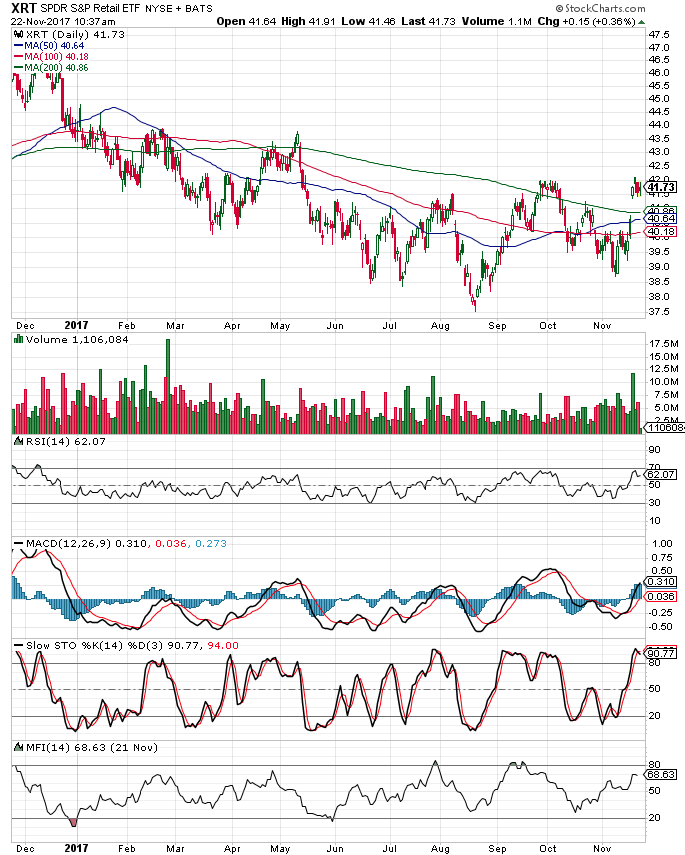
It's for these many reasons that I can now predict an end to the long term destruction in US retailers. As my son and research assistant Tyler reminded me this week, "Amazon is not the only company that's learned to use the internet to grow their business. The weak hands have already been driven out of business...today, only the strong have continued to survive". 
 
Now, take a look at this 2 year chart of XRT (Retailer ETF). First, XRT remains 13.5% below its 2016 highs...in this kind of powerful bull market its hard to find any sector that's down this much from its highs. As a contrarian, we love this disparity.  


For all of the myriad of reasons I've written about, I expect this highly bullish seasonal period (November-May) to produce the next ramp higher in the broad markets. Last week the bears had their chance to take the markets lower with back to back intraday DJ losses of 150 points. But the bears look to have failed, as the markets came roaring back mid-week (outside of a Friday -100 point day). 
 
For the DJ to reach my 25,000 target by year end we'll need to see a 6.8% move higher to close the year out. Admittedly, that's one heckuva Santa Claus rally, but whether or not we reach 25k by year end, I remain highly confident (based on VRA System readings) that a sharp move higher is directly in front of us. 

US markets look near-perfectly poised to have a strong close to this holiday shortened Thanksgiving week and then begin their next spike higher to fresh all-time highs into end of year. Based on the VRA System, we MUST stay fully invested in the market.

Finally, I'm looking for a vey solid close to trading this week, and a continuation of a big move higher into year end. We are positioned well. The best value that I see today resides in energy, precious metals/miners, biotech and the retailers. Until the facts change, this is how we'll continue to stay fully invested. 

Until next time, thanks again for reading....have a very Happy Thanksgiving! 

Kip 


To receive two free weeks of the Daily VRA Updates, sign up at VRAinsider.com

Friday
Nov172017

VRA Update: 25,000 Year End Dow Jones. The VRA Approach to Crushing the Market, Sentiment Back to Heavily Bullish Readings.

Nov 17, 2017

Good Friday Morning all. A big recovery day in the markets yesterday, with 1% to 1.5% moves higher across the board in the Dow Jones, S&P 500, Nasdaq and Russell 2000.

As we’ve covered here often, in powerful equity bull markets like the one we are in today (globally) corrections are short-lived, quickly reversed and soon thereafter lead to fresh all-time highs. This is what we witnessed the beginning of yesterday. Take a look at these internals:

1) 4–1 across the board, advances to declines

2) Almost 10–1 new highs to new lows

3) Nasdaq at close to 10–1, up volume to down volume

The internals of the stock market make up an important element of the VRA Investing System. Even during the “pause” the markets internals held up well. Were this to be a large decline in the offing, the internals would have been negative, over a 7–14 day cycle. We did not get a whiff of this…instead, we saw a near immediate reversal move on heavy volumes.

Combined with the manner in which investor sentiment flipped from bullish to bearish over the course of just one week…along with record numbers of investors buying the VIX (fear index)…the VRA System signal was clear; the pause was to be short-lived only. Next up, the year end rally is ON. My DJ target of 25,000 by end of 2017 remains intact.

The VRA Approach to Crushing the Market

Going back to inception of the VRA in 2003, each year we have outperformed the markets (using the S&P 500 and Russell 2000 as benchmarks) in 13 of 14 years. Through the 3rd quarter of 2017, our positions were up an average of 44%, versus just 11% for the S&P 500 and 9% for the Russell 2000.

Going back these 14 years we have had numerous VRA buy rec growth stocks that have risen 500–1000% while also using the VRA System to time our purchases of leveraged ETF’s and big cap domestic/international buy recs, giving us exposure to the broad markets as well.

The VRA has always been aggressive. It always will be. My investing style is not for everyone, for just this reason, but for those willing to invest a portion of your funds in high growth opportunities, well…this is my niche market. This is my USP (unique selling proposition).

I have always recommended building concentrated positions in my favorite holdings because this is how big gains in your portfolio take place. Peter Lynch, the best mutual fund portfolio manager in history (Fidelity Magellan Fund) averaged 28% returns over a multi-decade career. He did this by investing in growth stocks that he loved (great products with great mgt team) and then holding those positions until the story changed.

Remarkably, Lynch made money on just 6 out of 10 stocks he purchased, over the course of his career. 60% is Hall of Fame on steroids numbers for a baseball player but one might think that the best in the business could do better than a 60% success rate.

Here’s the key to his success; Lynch wrote often that the vast majority of the stocks he bought tended to produce small returns for an extended period (sometimes for years)…he used these pullbacks to add to his positions…because once his favorite stocks began to run, they REALLY took off. Lynch made his big killings in stocks that he owned for 3–4–5 years. By that time, he had accumulated big positions in his favorite companies. And his patience allowed him to crush the markets.

My approach with the VRA is similar to Lynch’s, but a big part of my work is timing the markets to ensure we are on the right side of both short and long term moves. Bottom line; I would rather not have to wait 3–4–5 years or more for my favorite investments to soar. And I really don’t want to lose money on 4 out of 10 holdings.

VRA Portfolio Holdings That Have the Potential to Jump 50–100% + With One “Event”

Having worked on Wall Street for 15 years, I know my personal investment psychology. Over the years my clients came to me because my own style matched theirs. I want to beat the markets, year in and year out, but what I really want to do is absolutely CRUSH the markets. I also know thats why many/most of you are here with me today.

In order to accomplish this, we must buy/hold growth stocks that have the potential to rise 50–100% + in very short order….namely on one “event”.

VRA Market Update

Below is a (rather large) screenshot of how various markets have performed through this past Friday. Dow Jones and S&P 500 up about the same (15% and 18%), while the Nasdaq has jumped a big 25% and the Russell 2000 (small caps) pulling up the rear, up just 8%.

The one that gets our attention of course is Bitcoin, up a huge 617%. While I’ve written positively about Bitcoin for years I have never officially recommended it…it does not trade as a stock, and while that’s similar to gold and silver in many ways…I have not yet found a method of investment that would allow me to include it in the VRA Portfolio.

But that should change in early 2018. I received word over the weekend that 2–3 IPO’s will be taking place that will allow us the opportunity to jump on the Bitcoin train, officially. As I learn more I’ll give you an advance heads up. Based on what I am hearing, a February launch looks likely. And no, based on the VRA System I would not recommend buying Bitcoin (or other crypto currencies at todays prices). A shakeout is taking place…we’ll wait until we have better timing…which looks to be a Google-like IPO of a crypto currency system…again, early to mid-February.

What we also see above is the fact that gold has risen some 10% in 2017. Take a quick look at the chart below. We see a most interesting pattern when it comes to December FED rate hikes.

The FED has raised rates twice in December, over the last 2 years. As you can see below, both rate hikes brought with them a huge move higher in gold (and an even larger move higher in the miners).

Following the 12/15 rate hike, gold spiked a big 31% over the next 7 months. Then, following the 12/16 rate hike, gold went on another tear, rising more than 20%in the following 8 months.

See the pattern here?

Next up, the FED will almost certainly raise rates at next months meeting. Should gold repeat its past two spikes, which brought an average gain of 25%, the next move in gold will take it from its current price of $1278/oz all the way to $1592/oz.

AAII Investor Sentiment Survey

The latest readings from the AAII Investor Sentiment Survey, my go-to sentiment survey for more than 25 years. As you can see, bullish percentage has collapsed back to 29.3%, a huge 15.8% drop in just a week, while bearish investors have surged to 35.2% with neutral investors at an also enormous 35.2%.

And folks, this massive jump in pessimism took place with just a small move lower in the markets. Stunning changes. Let me repeat…this is not how bull markets end…not even close. Bull markets end when bullish % is over 60% for weeks on end. Bull markets end when everyone and his/her mother is ALL IN…and are certain that stock prices will soar going forward. Just based on this reading alone, it is highly likely that this short term pause in the markets is close to ending.

We also got this update on the VIX this Wednesday. The VIX index is also referred to as the “fear index”….a gauge of investor optimism or pessimism. What we see below is that investors are buying the VIX more aggressively than at any point this year, which also means at any point EVER.

Never in the history of the VIX have investors been this bearish. As a contrarian you already know what this means….its almost certainly time to take the other side of this equation…the majority is very, very seldomly on the right side of any trade.

OIL Update

Take a look at this 3 year chart of oil. Besides the major bottom that you see below from 2/16, take a look at the explosion in trading volumes.

My mentors taught me that “volume precedes price movement” and nowhere can that be more clear than the surge in oil trading volume below.

Based on everything that I look at, from both fundamentals and technicals, the price of oil is in a multi-year bull market that might just send oil prices back to the $100 levels far faster than just about anyone is forecasting. We certainly have a Mid East war brewing…the sides have been drawn…Saudi Arabia vs Iran (with allies backing both sides that appear ready for a fight). We are positioned here perfectly.

Until next time, thanks again for reading…

Kip

To receive two free weeks of the Daily VRA Updates, sign up at VRAinsider.com

Tuesday
Nov102015

VRA Update: Trading Strategy - From Now to Year End

The markets sold off aggressively on Monday, with the Dow losing 179 points, or 1%, and each major index suffering similar percentage losses.

We've been highly overbought for some time, but this correction looks to be much more about the future of interest rates. More specifically, this weakness is about the FED and the month of December...will they in fact raise rates, following their meeting on Dec 15th and 16th. 

You may remember my thoughts...but let's put them in one place, just to be clear:

First, after waiting 9 1/2 years to raise rates, I see NO WAY that the FED would raise rates just 9 days prior to Christmas ...a borderline insane decision that would ruin far more than just the "spirit" of the shopping season. 

Can't you just hear business leaders, from all over the country, saying the following right after holiday sales stink (once again), with the stock prices of retailers having also collapsed in price: 

"Ms. Yellen, retailers all over the country depend on a solid holiday shopping season for as much as 75% of their annual revenues and profits. The FED's decision to raise rates...for the first time in almost a decade and incredibly, just one week prior to Christmas...has completely destroyed our hopes of turning a profit."

In reality, turning a profit would be most retailers last thought...staying in business would quickly become their primary concern.

Second, assuming I am correct...and I am confident enough to use 90% as my figure...here's the most likely outcome over the next 2-3 weeks...including another prediction that no one else sees coming today:

1) The stock market will continue to work off its overbought condition, with additional selling pressure coming from those that mistakingly believe a rate hike WILL take place.

2) At some point in the next 15-30 days, and on the heels of heavy selling pressure in the markets, the FED will do something that will stun the "experts". 

Without even waiting for their December meeting, Yellen will make a special announcement to the world that "a December rate increase is OFF the table"...hoping against hope that their confusing indecision and God-awful timing, has not already ruined the holiday shopping season. 

Should the above scenario play itself out, everyone reading this will want to STAY FROSTY:

1) Make sure you are positioned for profits on the way down

2) As the markets drop, from their current overbought levels to oversold, use that weakness to take profits on your short positions, then reverse course and go very long stocks.

Obviously, we'll use the VRA Trading & Investing System to ensure we are positioned correctly. 

If my predictions hold up, we can use this advance game plan to book some incredible profits (on top of the 830% in net gains for 2015).

Until next time, thanks again for reading...

Kip

PS; I honestly cannot believe that seasoned veteran after seasoned market veteran is now saying the FED will raise rates in December. Do they not have calendars? Do they not have common sense???

I know the FED makes huge mistakes all the time...with their 1000+ economists on the payroll...but raising rates for the first time in a decade...just before the holidays?? 

Insanity is the word that comes to mind...but hey, I'm sure the FED will make their decision based purely on the "data" and without any thoughts whatsoever on how a rate hike might affect the stock market :))


Page 1 ... 17 18 19 20 21