Journal Archive

"Kip's VRA financial newsletter is a MUST read for every saavy investor in this country. Disregard it at your own peril. His mantra is my mantra. Kip Herriage's newsletter is my financial Bible."

--Wayne Allyn Root
2008 Libertarian Vice Presidential candidate
Author, "The Conscience of a Libertarian"

SUBSCRIBE TO OUR BLOG!

* indicates required
Twitter: @kherriage

Entries in vraletter.com (51)

Wednesday
Jul122017

VRA Update: Housing is Rocking. Perma-Bears Continue to Amaze.

The Trump-mania bull market continues with no signs of slowing down. The VRA has been bullish on US markets since early 2013 and my LT targets remain in place...Dow Jones 25,000 on the low side...but what's more likely is a massive blow-off rally phase that sees the DJ top 30,000. All before the end of Trumps (first) term.

First up today, the broad market and some VRA Analysis. It never ceases to amaze me how the perma-bears come out of the woodwork each time we have a modest correction. I've fallen into this trap a time or two along the way, but only from the position of short term, massively overbought market trades designed to make short term profits as the markets corrected. However, longer term, the VRA has been bullish since 2013 and I see no reason to deviate from this view today. This is when I have to post a fresh housing chart, to make my case as clear as possible.

Below is a 15 year chart of HGX (housing index). I've included two blue circles. The first represents the 2005 highs in housing. Once the highs were in place, the bottom really began to fall out in early 2006. This is when I began to post warnings to VRA Subscribers that something big was coming and that it almost cleanly would not end well. I was a bit early...the stock market would hold up until 2007...but then the bottom fell out and we all remember the end result; the worst economic crisis since the Great Depression (while the VRA booked 630% in net profts during the worst 6 months of the decline). 

That horizontal blue line you see below tells us something very interesting, namely that HGX is just now approaching a new all-time high for housing stocks. Let me repeat; in my now 32 years in the investment business there has never been a significant market top when the housing market was performing this well. This is a point that perma-bears cannot argue...which is why they almost never discuss it.  

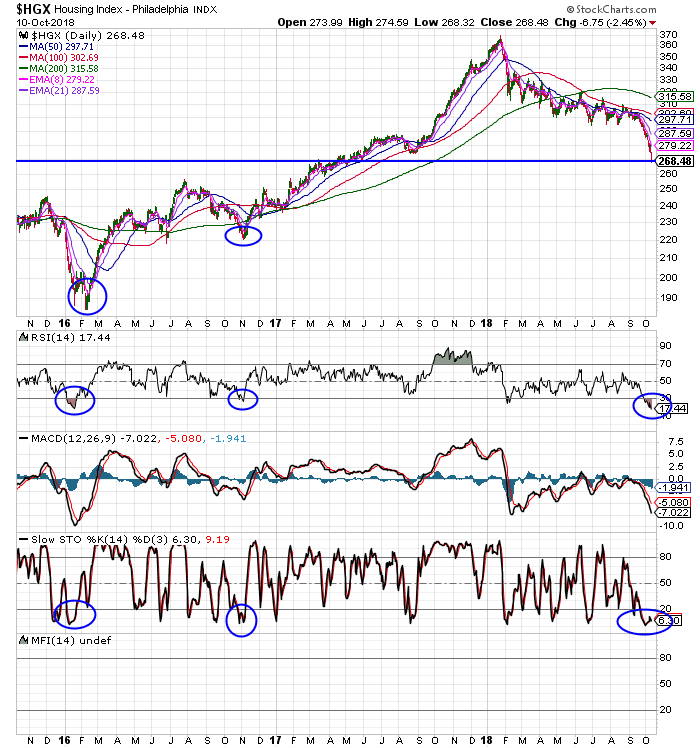
Two final points on housing. One; Donald Trump is one of the most successful real estate investors in all of history. As president, he knows that solid real estate/housing markets are the underpinning of a strong economy. He also knows that bank lending and money flows hold the key to expanding said economic growth. Hence, it's highly unlikely that this pattern of a strong housing market will reverse anytime soon. Add to this, the FED....even as they slowly raise rates....has made it very clear that they are more than willing to let the economy run hot before worrying about inflationary pressures building. Yellen and team have one primary job...protect their banking brethren...and they do this by insuring that the growth of debt markets is allowed to continue, without friction. I see nothing that says this commitment is about to change. NO broad market top is likely until housing reverses...

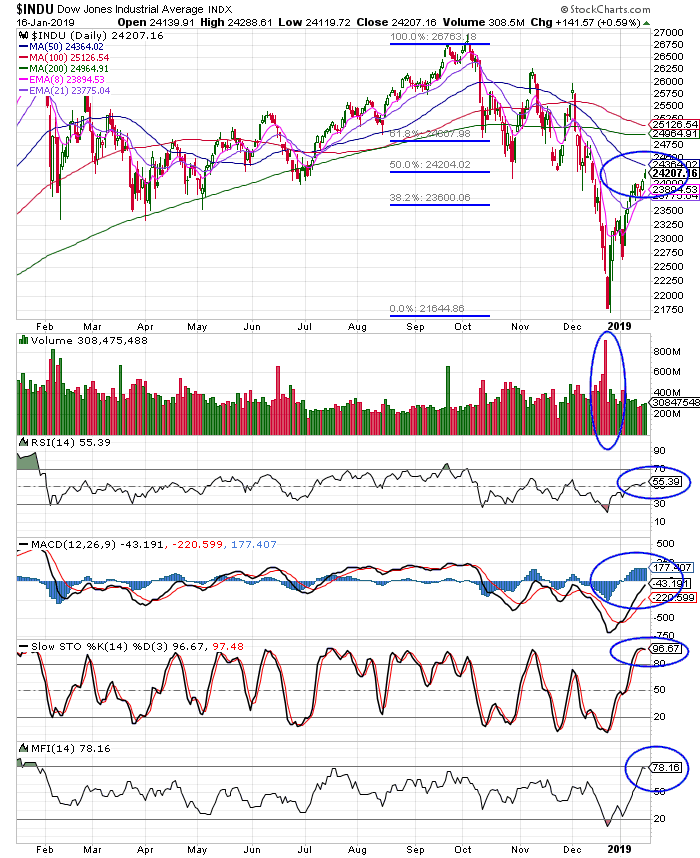
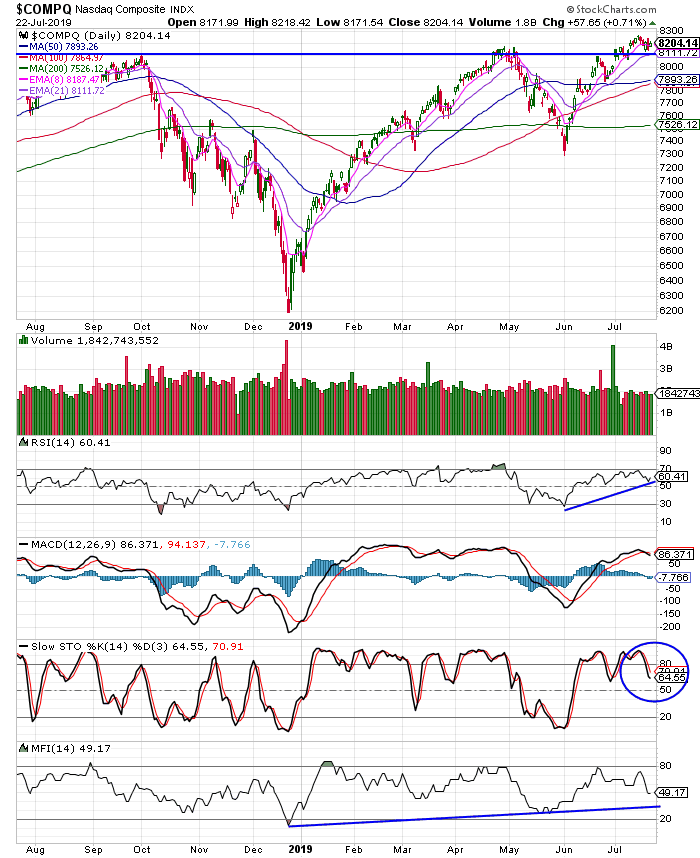
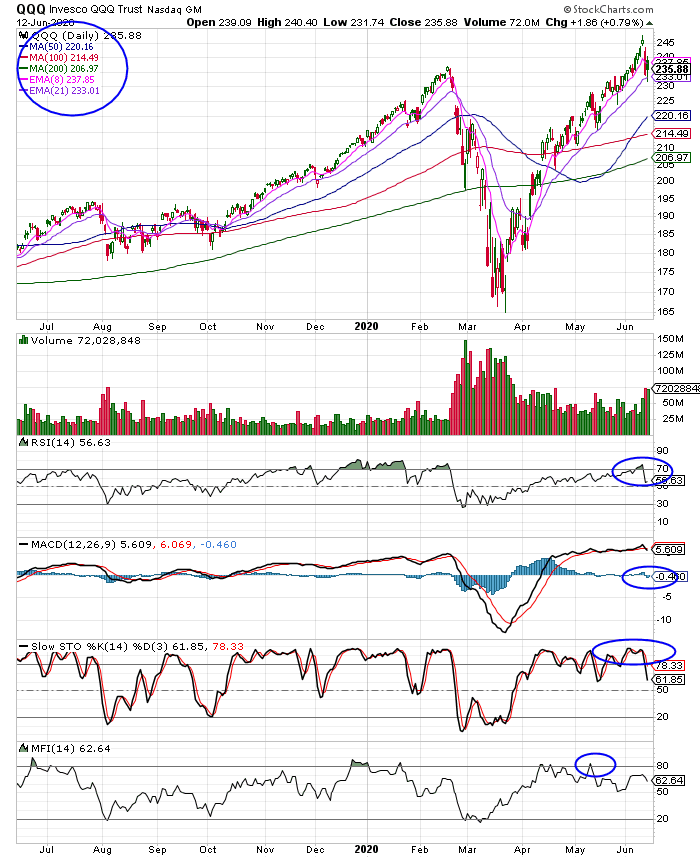
Next up, take a look at this 3 year chart of QQQ (Nasdaq 100). Recently, the QQQ fell below its 50 dma and is fighting to regain this important moving average. While not yet at extreme oversold levels that we've seen on the 3 occasions marked by the vertical blue lines below, QQQ is beginning to approach the same oversold levels that have marked moves higher of 20% plus. The bears that have come out of hibernation recently and are boldly predicting that the top is in place and that the next crash is directly in our path. 

Highly unlikely. Don't fight the tape...don't fight the FED (especially when central banks globally are aggressively buying both debt AND equities).

Yes, I continue to believe that FANG stocks are ridiculously overpriced...this certainly applies to Netflix (NFLX), which I see as the next company to be steamrolled by Amazon (and a myriad of fresh competition), but it's highly unlikely that the Nasdaq/QQQ will see a final top until we have that blow-off mania phase that marks the top of every major bull market. 

Let me also repeat; the Dow Jones will likely reach 25-30k before any final top is in place (barring the always possible black swan surprise). 

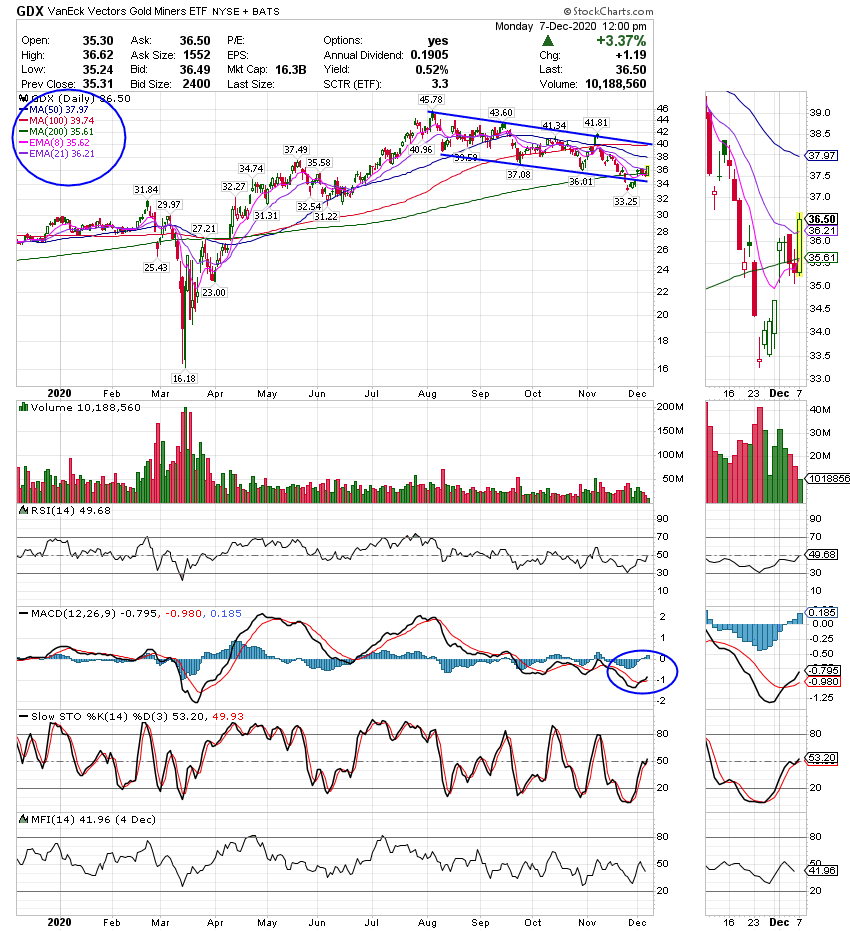
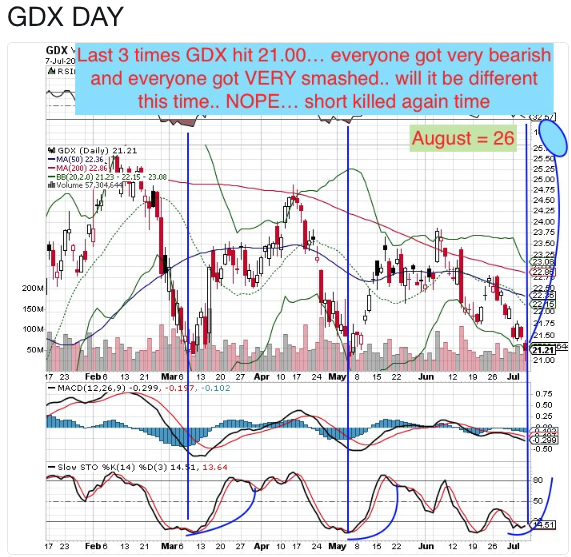
Next up, precious metals and the miners. I'm posting just one chart here below....its of GDX (miner ETF). This chart is not my handiwork but its making the rounds online and we see some most important developments in it. What you see below is GDX trading back towards the $21 level, a triple bottom going back to March. This level has served as a springboard for sharp moves higher each time and with GDX hitting 85% oversold, I look for exactly the same this time. 

As tempted as I am to aggressively recommend additional purchases of my favorite miners, I must also stick with the VRA System. This group (including gold and silver) MUST regain their primary trend bull markets (50 and 200 dma). Until this happens, caution is warranted. But remember, these are technical indicators only....the fundamental story of PM's and the miners could hardly be more positive. Massive global debt and bubbling currency inflation tells us that we MUST own this group for the long term. 

HT @bamabroker

Until next time, thanks again for reading...

Kip

Tuesday
Apr252017

VRA Update: VRA System Analysis. The Bubble Lives On. Dow Jones 25K

Before we get to the VRA Trading & Investing System Analysis, some observations on "The Bubble" we are witness to today...a bubble that mankind has never seen the likes of...and that just a decade ago would have been too bizarre to turn into a book or movie...no one would have believed $15 trillion in global QE (in only a decade, no less) would even be remotely possible. And, I stopped counting the level of fresh fiat currency printing, fresh debt issuance, about the same time I stopped counting the level of unregulated derivatives outstanding, which topped $1.3 quadrillion (back in 2015). 

But folks, this bubble could just be getting started. That's what makes a bubble a bubble...they extend to levels that no one thinks are possible. And right now, with bearish sentiment among investors at such historically high levels (as we see each week in the AAII survey), it's becoming more and more likely to this market observer that global equity markets could soar for Trumps entire first term...an outcome that, intellectually, I still find hard to come to grips with...but bubbles don't work via brain power...bubbles work via bubble power. And this bubble might be a special one....certainly one that still has lots of legs left. If you read my new book, you know that I believed the first 2 years would be rough for Trump. While this could still be the case, outisde of ordianry pullbacks and corrections, I see none of the tell-tale signs that would mark a more serious decline (unless of course we factor in any of the global, ever present, black swans).

Back in late 2014, When the Dow first crossed 18k I began writing about the very real possibility of Dow Jones 25k by the end of 2018, and while there's no one on the planet that knows what the future holds (making my conjecture mostly a silly exercise), a fresh look at some of the most important facts....plus the VRA System Analysis...should help us. 

As we go through this, know that the Dow is up just over 240 points as I write, back above 21k and just 60 or so points away from another fresh all time high. Based on the action we are seeing, unless the markets completely reverse course just prior to a new high, the benefit of the doubt has to go to "The Bubble" and its ability to live on. This market is bulletproof...using every pullback to suck in the bears...which only pushes the market higher, as they are once again forced to cover.

Remember the Trump fears from folks like Mark Cuban and 80% of Wall Street soothsayers? The Dow could drop 10%....20%....it might even be cut in half? Uhhh....nope.

How about the fears of Brexit and the global collapse that would take place, should the UK bolt the EU. Nope....

Then this weekends first round in France....for the first time in modern times, neither ruling party will have a candidate in the final run-off come 5/7. But do stocks collapse. Nope...they scream higher...while at the same time, bond yields barely budge. 

This is a one of a kind bubble...one that might wind up being bigger than just about anyone can imagine today. 

As we know all too well, central banks appear, well...there's really only one word for it...desperate. First, they continue to pump stock prices higher and higher. They do this both directly and indirectly. Directly through either straight up equity buying (as in Japan and China and God-only-knows how many invisible hands the FED employs elsewhere around the globe), but also indirectly via their purchases of corporate debt (in Japan, China and all throughout Europe/the EU, plus once again, the FED's invisible hands). These corporate bond buys by global central banks then serve as a proxy for corporations to continue buying back their own shares at record levels. Rinse and repeat. Rinse and repeat. 

This is the essence of our global central bank shell game. It kicked off in earnest following the 07-09 financial crisis and has only picked up serious steam from there. 

With interest rates remaining unbelievably low this late in the cycle, its also clear they want rates to continue falling. There is simply no evidence to the contrary...at least until the bond market vigilantes mark their return from a 32 year hiatus. 

What makes these low rates so remarkable...with the 10 year yielding just 2.3%...is the chart of the housing index that we have focused on recently. Heres an updated 11 year chart of HGX, which hit another 11 year high on Thursday....showing absolutely no signs of wanting to reverse. 

And with the king of real estate & debt in the White House, it might make perfect sense that we should have another 2-3-4-5-? years of real estate bullishness. Hey, your guess is as good as mine...but this next part is not a guess; economic recoveries do not end when real estate is flying high...it's simply not the way it works.

Of course, a world war with Russia/Iran/North Korea (China)...one that might even include a few nukes...would bring this party to a crashing halt overnight...these are the scary as hell black swans we are forced to live with. 

Let's wrap this up with the things that I can speak much more confidently about...the VRA System and some chart work:

I normally point to the chart of the S&P 500....now, lets take a look at the Dow Jones. 

The breakout that began on Monday took the Dow out of its flag pattern and it did so with a positive resolution. The bears had their chance and once again, they look to have failed. 

While still a few points below a new high, the Dow looks ready to take the old highs on and easily surpass them as well. The Dow just got a fresh buy signal as well, with the MACD turning bullish, all while the oversold levels are now reversing....also giving a fresh buy signal on RSI. Still fully bullish, based on my VRA System (which has remained LT bullish since 2012).

But its this next chart that has people talking....take a look at the Nasdaq:

That circle you see represents todays 73 point move higher from yesterday, to another fresh all time high. My mentors taught me that a soaring Nasdaq represented a "sexy market" that wants to push higher. The chart below qualifies as sexy...with the kicker that we also got a fresh MACD buy signal today as well. 


But, at the same time, check out yesterdays CBOE Put/Call ratio. The Dow never really fell below +200 points, but remarkably, investors were buying puts all day long. Anything over 1 means investors are bearish...and it actually closed the day at 1.05, the highs of the day. 

In this mornings open, these put buyers are turning into fresh index/call buyers....again, pushing stocks higher still.
TIMECALLSPUTSTOTALP/C RATIO
9:00 AM 497582 491981 989563 0.99
9:30 AM 749706 696825 1446531 0.93
10:00 AM 1022265 949984 1972249 0.93
10:30 AM 1153216 1138855 2292071 0.99
11:00 AM 1303276 1322000 2625276 1.01
11:30 AM 1466704 1468224 2934928 1.00
12:00 PM 1642180 1644805 3286985 1.00
12:30 PM 1730765 1734456 3465221 1.00
1:00 PM 1859668 1833885 3693553 0.99
1:30 PM 1959914 1982897 3942811 1.01
2:00 PM 2095219 2093368 4188587 1.00
2:30 PM 2264818 2309353 4574171 1.02
3:00 PM 2456804 2578754 5035558 1.05


We looked at gold last....still giving a strong buy signal above all important technical levels....so lets look at the mining ETF, GDX.

While still overtly bullish, from those early 2016 lows, the miners refuse to fully participate with gold/silver. Of all the charts that I follow, its the miners that have me most flummoxed. The fundamental story could not look better. Record global debt levels....rapidly rising real inflation levels...ungodly amounts of fiat currency printing...but the miners have yet to really come to life. 

But when we look a bit closer, we see a rising bullish wedge/triangle...one that I believe MUST result in a massively sharp move higher, as "The Bubble" continues along its merry way. Folks, the bubble that we are living through today tells me one thing; gold and silver...and most certainly the miners...are about to join this party. Here's what I believe we will see next; GDX will break through the upper trend line, then its 200 dma, which today sits at $24.54...and what follows will be a monster move higher. 

The consolidation that we are seeing today will serve as a "coiled spring"...yes, this is an actual technical term...with the miners breaking to new all-time highs. This bubble demands it!

We buy them when they are cheap, so that we may profit from them when they are no longer cheap. This is the ONE group that every smart money investor I know and trust is buying...for spectacular LT gains. 

Finally, my stock of the century (VRA Subscribers) is holding onto 2.5 month gains of more than 300%. I will issue a clear heads up on the next move higher...it will be a remarkable ramp. Continue to dollar cost average.

Until next time, thanks again for reading...

Kip

Sunday
Apr092017

VRA Update: Trump's Pattern Change. It's Time for Insurance

Because pattern/trend analysis is such an important investing concept for active (and passive) investors, it's time that we address the politlcal elephant in the room...the possibility that the Donald Trump of the campaign trail may not be the same Donald Trump that we now have as President. The possibility that a pattern change is occuring...

Remember, $3 trillion in US stock market gains have occured since 11/8, with much of the credit going to our newly elected president. It's not called the "Trump Rally" for nothing. Plus, as you've heard me cover many times, the first year of a new presidency is when all sorts of bad things tend to happen; the Civil War, both World Wars, Vietnam, plus 9/11...each of these started/took place in a new presidents first year. Add to these, 10 bear markets and 8 serious recessions...with each starting in year 1. 

No, I am not off the Trump train. But I'm also not a blind follower, of anyone. And, hypocrisy may be my least favorite personality trait, period.

First, we saw Thursday nights military strikes in Syria. Whether you support the launch of 59 tomahawks against an airbase in Syria or not is not really the issue...at least not for me. The Trump that I remember casting a vote for repeatedly attacked then President Obama for his own involvement(s) in Syria. I'm sure you've seen the tweets and remember his many warnings, like this one: "why would we get involved in a war in Syria, a country that has done nothing to America? Is it worth starting World War III with Russia over? Huge Mistake!!"

Hypocrisy. There can be no other word for it.

BTW, according to multiple media reports, the airbase that we struck, as our primary target, is once again (mostly) operational, meaning that the $90 million or so we just spent on tomahawks may have had no real effect whatsoever.

Second, if the attack was a one-off, it might make some sense...new sheriff in town and all. But that now appears NOT to be the case. On CNN's 'State of the Union" this morning, UN Ambassador Nikki Haley just stated that "regime change in Syria is one of the Trump administrations top priorities in Syria." Exact quote.

But, just one week ago, Haley said "the US was no longer focused on getting Assad out." That's a very fast policy change, and again, not at all what we heard from #45 on the campaign trail. 

Pattern change. 

Regime change means US boots on the ground, and lots of them. A major military action like this will likely require more than 100,000 US troops in Syria, and that number may be low. In fact, late last night, one of the most instinctive and well-informed journalists around, Mike Cernovich, broke a story that reported the die may already cast and that "Trump is being manipulated (by Flynn’s replacement, McMaster) into sending 150,000 US troops into Syria". You can find his reporting on Twitter @cernovich. BTW, Cernovich was the first to break the Susan Rice “spying” story. He also broke a number of important election-impacting stories, so he's absolutely someone to pay attention to. 

Is this what we want, as a nation? Do we want to remove "another" countries leader? Most of us remember the disastrous consequences of removing Iraq's Hussein and Libya's Gaddafi, all too well. Let’s also keep this most important point in mind; Assad has been (effectively) fighting our sworn global enemy, ISIS, and doing so at great cost. Assad might also be the only thing standing between the complete slaughter of non-Sunnis in the country, including Christians.

Once again, regardless of whether US action in Syria is the right course of action or not, is this the Trump that we voted for? Personally, I can tell you that this is most certainly NOT the Trump that I voted for.  

Third, we've just learned that Trump has ordered a Navy strike group (4 ships) to the Korean peninsula, sending the most direct threat/message possible to North Korea and it’s unhinged leader, Kim Jong Un. Reports are that North Korea will continue testing, likely this week, their nuclear weapon capabilities, something that Trump and Secretary of State Tillerson have repeatedly stated "will not be allowed to continue."

You get my point. Right or wrong, these are not the actions that Trump promised us, most certainly not in his first 100 days.

As I've shared recently with VRA Subscibers, what we are witnessing appears to be a significant "pattern change", as it relates to Trump. Whether we're talking investing or politics, when a well-established pattern changes, we must be on alert. Trump's well-established pattern for close to two years was "winning", and doing so by standing his ground, against all comers and against all odds.

First, we saw Trump lose his incoming National Security Advisor, General Mike Flynn (also one of his most important and respected allies, during the campaign). A VERY big loss. Second, Trump's rough health care bill defeat. This was a monster of a political loss, as Trump made healthcare reform and the "repeal and replace" of Obamacare, one of his most important campaign platform staples. It was the healthcare defeat that really caught my attention, especially when just 48 hours before the vote was to take place, Trump stated "just watch, it's going to pass" in his most confident braggadocio. But with something like 17% support, the vote had to be pulled, never even making it to the floor. That's not just a loss...that's an embarrassment of a loss. 

And now…military action in Syria…and possibly even North Korea.

Pattern change.

All combined, this is why we added “insurance” to the VRA Portfolio on Friday, by purchasing our favorite voaltility ETF. The VIX could be ready to have another monster move higher. And yes, increased military action and geopolitical instability will almost certainly be a positive for our precious metals and energy positions. We are well positoned...for several bad/worst case scenarios.

Should global tensions continue to build, we could easily see $20/barrel added to the price of oil and more than $100/oz added to the price of gold. Even these figures could be on the low side.

One final point, and it’s one I’ve made many times before. If we are destined to have another major war (God help us all), one important action should be required first; the draft must be reinstated…but with one important caveat. The first to be drafted will be the children of our elected officials (both state and federal). Then, following boot camp, send them directly to the front lines. 

Let’s see how many in congress would still approve of ramped up US military intervention(s)…much less, world war.

Until next time, thanks again for reading...

Kip

Friday
Mar312017

VRA Update: Wait Til May, To Sell and Go Away

All week long, the markets have rallied back off of opening losses...just as we expected...with solid moves higher off of 21 dma, 50dma and 100 dma. Nothing about this market says "sell".

Remember, April is historically the strongest month for stocks, with a 1.9% average gain going back to 1950 (with thanks to my friends at the Stock Traders Almanac).

End of quarter window dressing is here...lots of money coming into the market via tax planning/retirement plans...and once again, the shorts look to have been premature in their negativity. Take a look at this pretty amazing chart of the S&P 500 and market shorts. When the SPX was at its highs, short sellers hit their lowest recorded levels in this ETF's history (we covered this exact phenomenon here in the VRA roughly 3 weeks ago). But all it took was a few days of selling pressure....now the shorts are back to 65% of their previous levels.

In today's central bank controlled, funny money markets, in many cases the fuel for sharp reversals higher is short sellers covering their shorts (following brief corrections). I expect we'll see more of the same for the rest of the next month, as end of quarter buying and short covering propel stocks higher, followed by an historically strong April.

The VRA System started noticing this last week....the internals began to improve on Thursday, and as of Monday, each major market had reached 80% oversold levels or greater. Let me put it this way...I would not want to be short here...at least not until the month is over and we see how the markets react as we enter April. 

Highly Bullish Pattern in Silver

The chart below has 3 circles. What you're looking at here is called an "inverse head and shoulders pattern" and it is considered to be one of the 5 most bullish chart patterns. The key is in the interpretation...as always...but I know these patterns well and this one absolutely looks legitimate to me. 

Just the opposite of a "head and shoulders" pattern (which is highly bearish), inverse H&S patterns can propel an investment sharply higher and in a short period of time. The shoulders below are not perfect...they rarely are...but these line up very well. In addition, silver is now over its 200 dma....another big time bullish technical event. 

We also see that gold has surpassed its 50 dma and could blast through its 200 dma in the coming days. GDX is has struggled to stay above its 50 dma and folks, this is where the action is about to be explosive. 

Think about what's approaching; both the French and Italian elections (with the survival of the EU hanging in the balance). Will the US reach a budget agreement...or will the govt close down again? The talk will be just as we've seen in recent years "will the US default on its debt and other financial obligations"? 

But more than anything, here's what I continue to hear; the suppression of gold/silver pricing is coming to an end. Gold demand is soaring globally, with central banks, China, Russia and the Mid East accounting for massive demand. 

Make sure you have solid positions in our favorite miners. 

Finally, most every bear that I know is betting on a sell-off come Monday morning (end of qtr). But if we open higher, short covering could give us a big up-day....with a Tuesday correction, instead.

Until next time, thanks again for reading...

Kip

Saturday
Mar182017

VRA Alert: My “Stock of the Century” Just Soared 285% in 30 Days. 

I predicted that 2017 would be my best year ever. Looks like another of my predictions is coming true. But here’s what makes it that much sweeter…I so love destroying Wall Street’s shell game!

My “Stock of the Century”, following a most important news release, has just rocketed 285% higher...in just the last 30 days…but the move higher is only beginning.

I just received the following from Robert K. (New Jersey):

“Kip, you said this was going to happen. Now, it’s happening! Because of your recommendations, my portfolio just grew from $12,000 to $46,000 and it only took ONE month. Amazing. Thank you!!”

You’re most welcome Robert. My VRA System continues to demolish the Wall Street frauds, but my real expertise lies in picking huge winners.

Here are my top stock picks, all-time:

Ivanhoe Mines: I recommended Ivanhoe at less than $2/share and then took profits at $23/share, in less than 14 months. A $5000 investment turned into more than $65,000.

JB Oxford (one of the original online brokers): I recommended JB Oxford at .75/share and took profits at $22/share, in less than 1 year. A $5000 investment turned into $146,000.

And my all-time #1 recommendation, Ultra Petroleum; I recommended Ultra at .15/share and within 8 years a $5000 investment was worth more than $6 million!

My “stock of the century” may have just had a monster month…but now that the news is getting out, this is when the real fun starts…this company is on its way into the financial mainstream and I fully expect it to become one of my BEST all-time buy recommendations. When my stocks take off…they really take off. 

  Here’s an email I received three weeks ago from a VRA Subscriber:

“Kip, after losing money in the market with my broker year after year, I have finally found the one guy that not only makes us incredible money but that actually seems to care about OUR success. 500% gains in 2 months. WOW. I read your early morning updates right when you send them out and they are by far my favorite emails of the day. My wife and I sincerely THANK YOU!” TK and MK, Miami, FL.

Many of you have followed my work for years…some for decades…now is the time to make sure you are a Member of our community. My VRA Trading & Investing System is unlike anything you’ve seen before. I know, because I created it…no one else has it…it is my propriety work.

  * Each morning I email you before the US markets open. I tell you exactly what to own, exactly what price to pay and then exactly when to sell and take profits.

  * Your VRA Membership also comes with my two VRA Special Reports (“Making a Fortune in Precious Metals and Mining Stocks” and “Kip’s Stock of the Century”). My Stock of the Century may well more potential than any stock I have ever discovered.  Just this past month it has soared 285%, but that’s nothing compared to what it’s about to do.

  *  Your VRA Membership also comes with your private Members Site, my VRA Core Portfolio and every VRA Update that I have issued going back to 2005.

It’s my sincere hope that you’ll act on this invitation. For the next 72 hours you can join us for either 6 months or a full year, with a discount of up to 75%.

Just click on the link below. Choose either a 6-month or 1 year membership…at a savings of up to 75%!

https://vrainsider.com/vra-join

I look forward to welcoming you to our VRA Community. 

Kip 

Kip Herriage

VRA Founder/Publisher (2003)

VRAletter.com


Page 1 ... 2 3 4 5 6 ... 11 Next 5 Entries »